AI-powered terminal for researching global stocks with financial data, AI summaries, KPIs, filings, and portfolio dashboards.
651K visits/mo-10.2%#80 Business & Marketing

Analyze earnings calls, manage risk with data science, and generate stock ideas.
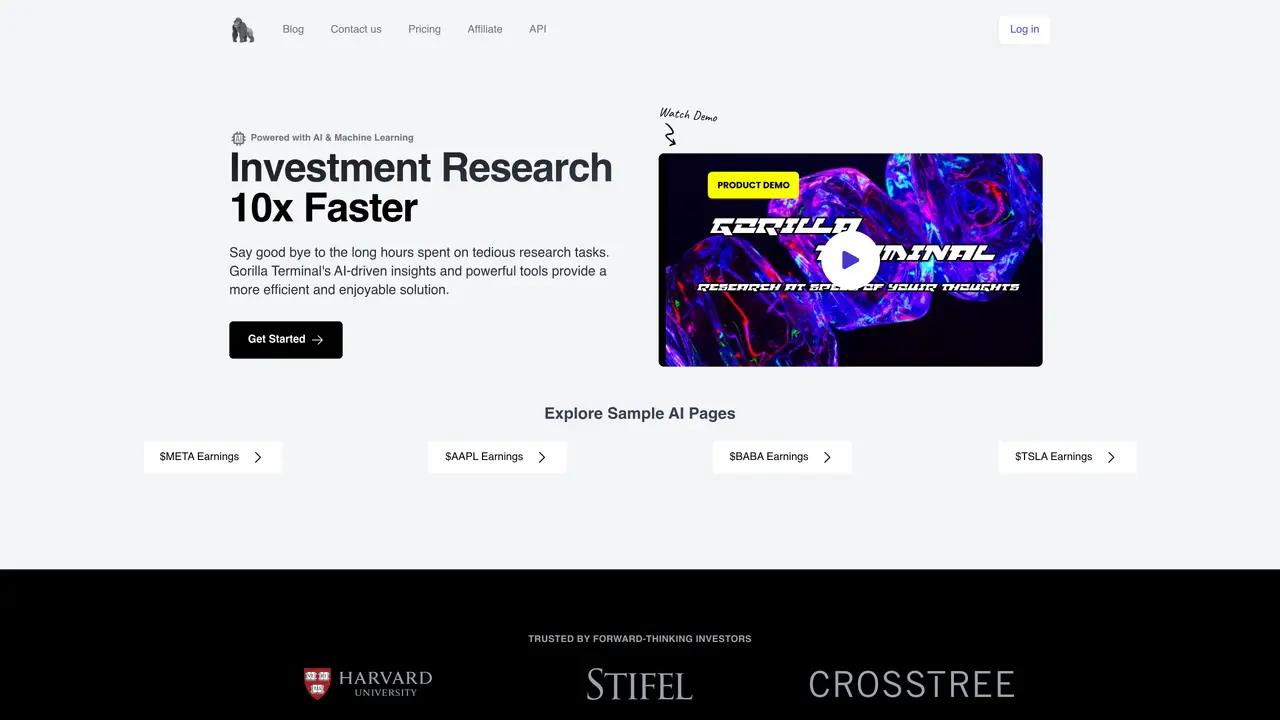
Gorilla Terminal is an AI-driven investment research platform designed to streamline and enhance the investment decision-making process. The platform aggregates a wide range of financial data, including macroeconomic indicators, stock charts, SEC filings, insider trading activity, and social media sentiment from Twitter, providing users with a comprehensive view of market conditions. Its intuitive terminal interface allows investors to access and analyze this data efficiently, supporting both fundamental and quantitative approaches to portfolio management. The platform incorporates advanced analytical tools such as regression analysis and Value at Risk (VaR) calculations to help users assess potential risks and optimize their investment strategies. Additionally, Gorilla Terminal offers sector-specific insights, enabling users to monitor industry trends and make informed allocation decisions. The platform is tailored for individual investors, financial analysts, and portfolio managers seeking a data-rich, AI-assisted environment to support their investment research and decision-making processes. Its design emphasizes usability, ensuring that complex financial data is presented in an accessible and actionable format.
Gorilla Terminal is an AI-driven investment research platform designed to streamline and enhance investment decision-making through a comprehensive suite of tools and data.
The platform is suited for investors, traders, and financial professionals seeking to leverage AI-powered insights for portfolio management and market analysis.
It aggregates macroeconomic data, stock charts, SEC filings, insider trading activity, social sentiment, and quant techniques into a single terminal interface for efficient research.
Users can conduct regression analysis, value at risk analysis, and access sector overviews to assess market conditions and investment risks.
The platform is designed to centralize investment research data and tools, though specific third-party integrations are not detailed on the website.
Visit the official website to explore features and sign up for access to the terminal interface and its suite of investment research tools.
gorillaterminal.com · third-party estimates from Similarweb
Last 4 months · grows by one month every month
Share of visits · estimated visits
Business & Marketing · Sep 2026
Traffic figures are third-party estimates, good for scale and trends; they can differ from a company's own numbers. Updated monthly.
We use essential cookies to run aitoolnavio™, and optional cookies to analyze traffic and measure our marketing. You choose what we use — optional cookies stay off unless you turn them on. See our Privacy Policy.
One short email a week: fresh tools worth trying, honest takes and the updates that actually matter. No spam, unsubscribe any time.
AI-powered terminal for researching global stocks with financial data, AI summaries, KPIs, filings, and portfolio dashboards.
Analyze data, automate processes, and optimize AI investments with expert guidance.
AI-driven stock analytics platform optimizing investment strategies.
AI-powered investing platform offering real-time quotes, stock screeners, chart analysis, backtesting, and brokerage-linked portfolio tracking.
AI trading platform that generates forecasts, detects patterns, and automates trading strategies for stocks, ETFs, and crypto.
Monitor markets, analyze stocks with data, and get personalized advice from experts.
AI-driven investing; no-code strategy creation, automated execution, community insights.
AI investing platform for retail traders offering real-time signals, AI stock picks, alerts, and broker copy trading.
Automate trading decisions, monitor markets, identify profitable trades, and build long-term portfolios for lasting returns.
Harness AI-driven insights from unconventional data for smarter investing.
Harness data-driven insights for sustainable investment decisions.
Matched on what this tool does — grouped by the job you would be replacing.
matches Analyze earnings calls with AI
An AI investing research platform that summarizes earnings calls, extracts financial data, and tracks sentiment for US public companies.
AI-powered due diligence platform for investors
matches Generate stock ideas
matches Access macroeconomic data · View stock charts and SEC filings
matches Monitor insider buying and sentiment on Twitter
Identify market trends and generate trade ideas instantly.
AI market analyst providing daily briefings, deep stock research, and alerts.
AI-driven stock analysis platform providing buy, sell, or no-trade signals for US equities
Stock market data API delivering real-time prices, fundamentals, and news for financial modeling and trading applications.
AI platform for detecting policy and macroeconomic signals in financial data
Track brand mentions & sentiment, analyze data, and generate detailed insights on brand performance & campaigns.
Monitor social media conversations, track trends, discover influencers, and generate customer insights.
Receive custom stock alerts, monitor stocks and sectors, and navigate an intuitive UI for quick and easy market analysis.