
OpenAI builds and deploys advanced AI models like GPT-4o for autonomous agents and workflows.

Pulse
$19/moStarting price
0Popularity
About Pulse
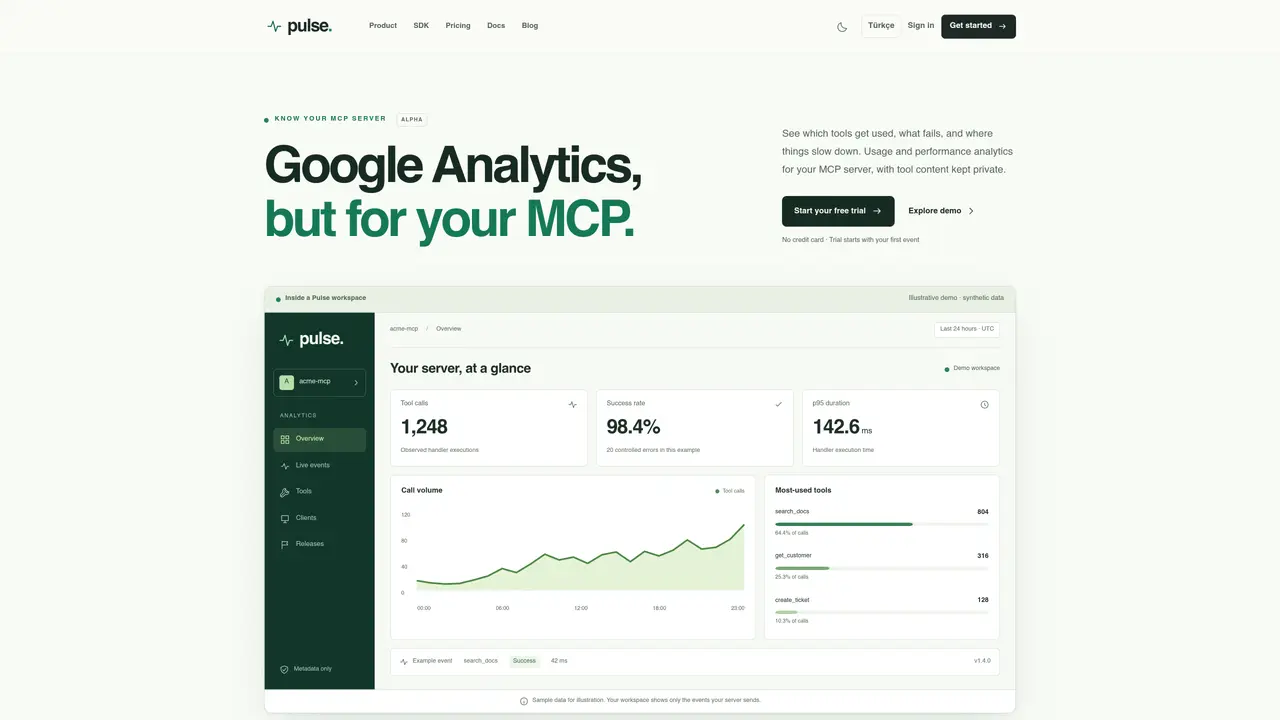
Pulse provides usage and performance analytics for MCP servers by observing tool calls without collecting prompts, arguments, or results. It tracks which tools are invoked, their handler durations, success rates, and error occurrences, presenting the data through dashboards that show call volume, percentile distributions, and filtered views by environment or release. The tool integrates via a small SDK that wraps an existing MCP server, sending metadata to Pulse’s cloud service in the background without proxying tool traffic. Users can segment data by environment, tool, or release to contextualize changes and investigate issues without parsing raw logs. The system is designed to measure adoption, reliability, and performance while keeping tool content private. It supports TypeScript MCP 2.0 servers and is verified on Node.js 24.20.0.
Key features
- Real-time call volume tracking
- Handler duration and percentile analysis
- Success rate and error rate monitoring
- Environment and release filtering
- Live event inspection
- Optional account context for pseudonymous analytics
- Bounded background batching for telemetry
- 90-day analytics retention in Pro plan
Use cases
- Debugging slow or failing MCP tool handlers
- Measuring tool adoption across environments
- Comparing performance before and after server updates
Pros
- Tracks tool call volume, durations, and outcomes without exposing content
- Provides percentile metrics (p50, p95) for performance analysis
- Supports filtering by environment, tool, and release for contextual insights
- Offers live event monitoring and historical analytics dashboards
- SDK integrates with existing MCP servers with minimal code changes
Cons
- Cloud remains in technical alpha with limited verified integrations
- Python, stdio, and specific host integrations are not yet supported
- Telemetry can be lost during outages or overload scenarios
- Requires Node.js 24.20.0 and MCP 2.0.0 for verified operation
Frequently asked questions about Pulse
What does Pulse do?
Pulse provides usage and performance analytics for MCP servers by observing tool calls without collecting prompts, arguments, or results. It tracks tool invocation metrics such as call volume, handler durations, success rates, and error occurrences, presenting the data through dashboards.
Who is Pulse designed for?
Pulse is designed for developers and teams who have built MCP servers and want to understand how their tools are being used, where performance bottlenecks occur, and which tools are most reliable.
How does Pulse integrate with an MCP server?
Pulse integrates via a small SDK that wraps an existing MCP server. The SDK observes tool handlers and sends metadata to Pulse’s cloud service in the background without proxying tool traffic or altering the original tool results.
Can Pulse track who is using my tools?
Account analytics are optional. The server can provide verified account context, which the SDK turns into project-scoped pseudonyms. Client names are self-reported, and missing metadata remains unavailable.
Does Pulse slow down or break my MCP server?
Measurement adds some local overhead, but events are queued and sent in bounded background batches. Exporter failures do not alter the original tool result, though telemetry may be lost during outages or overload.
What is included in the Pulse alpha?
The alpha includes a limited trial starting with the first accepted event, allowing users to explore tool analytics, live events, filters, and exports. No credit card is required, and paid checkout is currently disabled.