
Generate captions, optimize content, and enhance with custom images for maximum engagement.
46M visits/mo-10%#3 Image & Design

Turns text, URLs, or documents into customizable infographics with citations and brand elements in minutes.
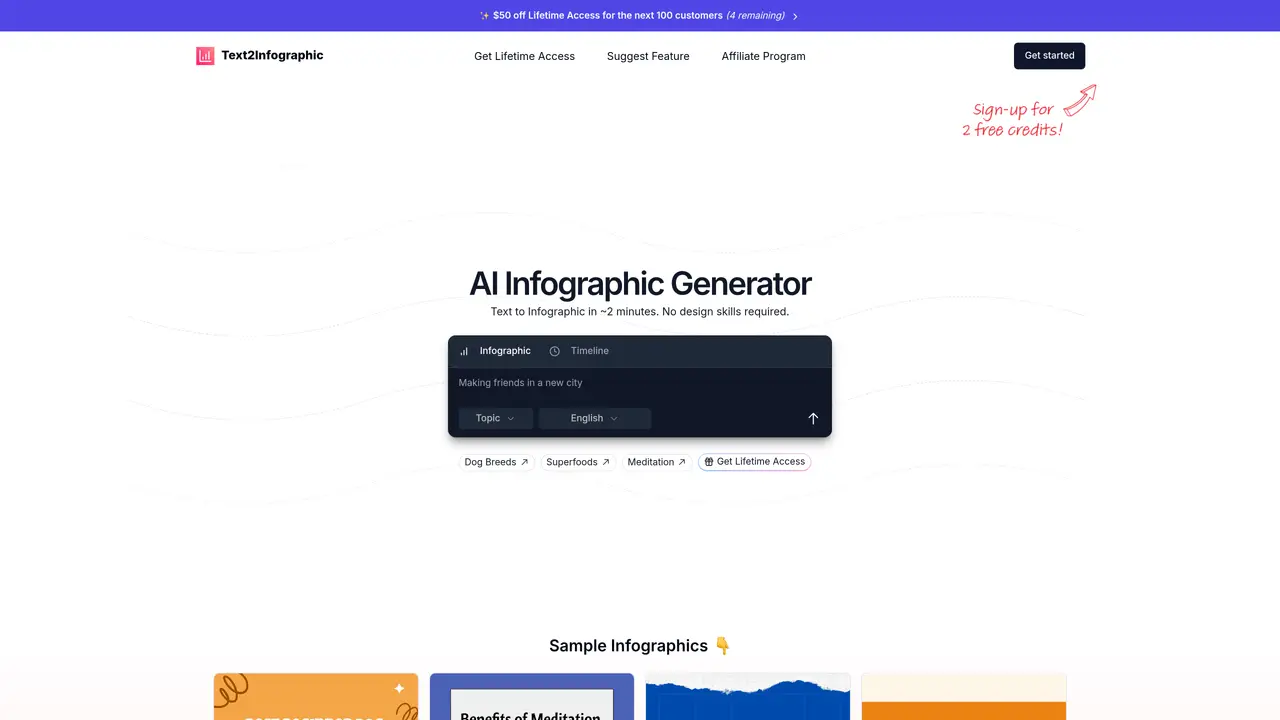
Text to Infographic is a web-based AI tool that converts written content—such as text, blog posts, URLs, documents, or spreadsheets—into professional infographics without requiring design skills. The process begins with automated content parsing and topic research, including auto-generated citations for sourced information. The tool then generates multiple infographic designs in about two minutes, which users can further refine in a built-in editor. The editor allows customization of colors, fonts, logos, layouts, and other brand elements, supporting over 20 languages. It also includes copyright-free image sourcing and chart generation, along with AI-driven layout suggestions. The platform is designed for marketers, content creators, educators, and businesses seeking to repurpose existing content into visually engaging formats quickly and efficiently. It emphasizes commercial rights and lifetime updates for its lifetime plan users, with enterprise options available via API access.
Text to Infographic is an AI-powered tool that converts written content such as text, blog posts, URLs, documents, or spreadsheets into professional infographics without requiring design skills. It automates research, content parsing, and layout design, generating multiple infographic options in about two minutes.
The tool is designed for marketers, content creators, educators, and businesses who want to repurpose existing content into visually engaging formats quickly and efficiently, especially those without design expertise.
Yes, the platform supports over 20 languages, allowing users to create infographics in various linguistic contexts.
Yes, users can refine generated infographics using a built-in editor to adjust colors, fonts, logos, layouts, and other brand elements, ensuring alignment with their visual identity.
Yes, the tool includes auto-generated citations for sourced information, ensuring transparency and credibility in the visuals produced.
Yes, enterprise options are available via API access, allowing businesses to integrate the tool's capabilities into their existing workflows.
text2infographic.com · third-party estimates from Similarweb
Last 4 months · grows by one month every month
Share of visits · estimated visits
Other countries: 29.1%
Writing & Content · Sep 2026
Traffic figures are third-party estimates, good for scale and trends; they can differ from a company's own numbers. Updated monthly.
We use essential cookies to run aitoolnavio™, and optional cookies to analyze traffic and measure our marketing. You choose what we use — optional cookies stay off unless you turn them on. See our Privacy Policy.
One short email a week: fresh tools worth trying, honest takes and the updates that actually matter. No spam, unsubscribe any time.
Generate captions, optimize content, and enhance with custom images for maximum engagement.
Create stunning visuals, develop ideas with AI-powered tools, and instantly share content without coding or formatting.
Headless CMS that lets developers manage structured content and deliver it anywhere via flexible APIs and real-time collaboration tools.
Analyze, collaborate, optimize content for quality, speed, and wider reach, with tailored suggestions.
Solvely is an AI homework-help app that solves math, science, and liberal arts problems with photos.
AI-driven tool for seamless, high-quality content generation.
Generate unique avatars and craft effective, engaging copy effortlessly.
All-in-one AI platform for writing, image, music, and analysis.
Accurately detects AI-generated content, monitors real-time dashboard, and ensures content is plagiarism-free.
Generate high-quality, SEO-optimized content effortlessly, saving time for blog posts, social media, and marketing copy.
Generate professional copy in seconds, customize with an intuitive platform, and access pre-written content for inspiration.
AI SEO platform that automates keyword research, content creation, and publishing for websites and e-commerce stores.
Matched on what this tool does — grouped by the job you would be replacing.
matches Converts text, URLs, documents, and spreadsheets into infographics · Auto-citations for sourced information · Copyright-free image sourcing and chart generation
AI-powered infographic generator that turns prompts into branded, customizable visuals for marketing, reports, and communications.
Turns prompts, documents, or links into polished, data-backed presentations and interactive infographics with AI agents.
AI-powered platform that turns blogs, articles or text into editable presentations, infographics and Instagram carousels.
Turns text, data, or images into professional infographics instantly with AI, no design skills required.