
Unleash creativity: edit photos, videos, and designs with AI-enhanced tools.
16M visits/mo-11.4%#6 Image & Design

Turns text into polished infographics instantly with AI-powered summarization, icons, and images.
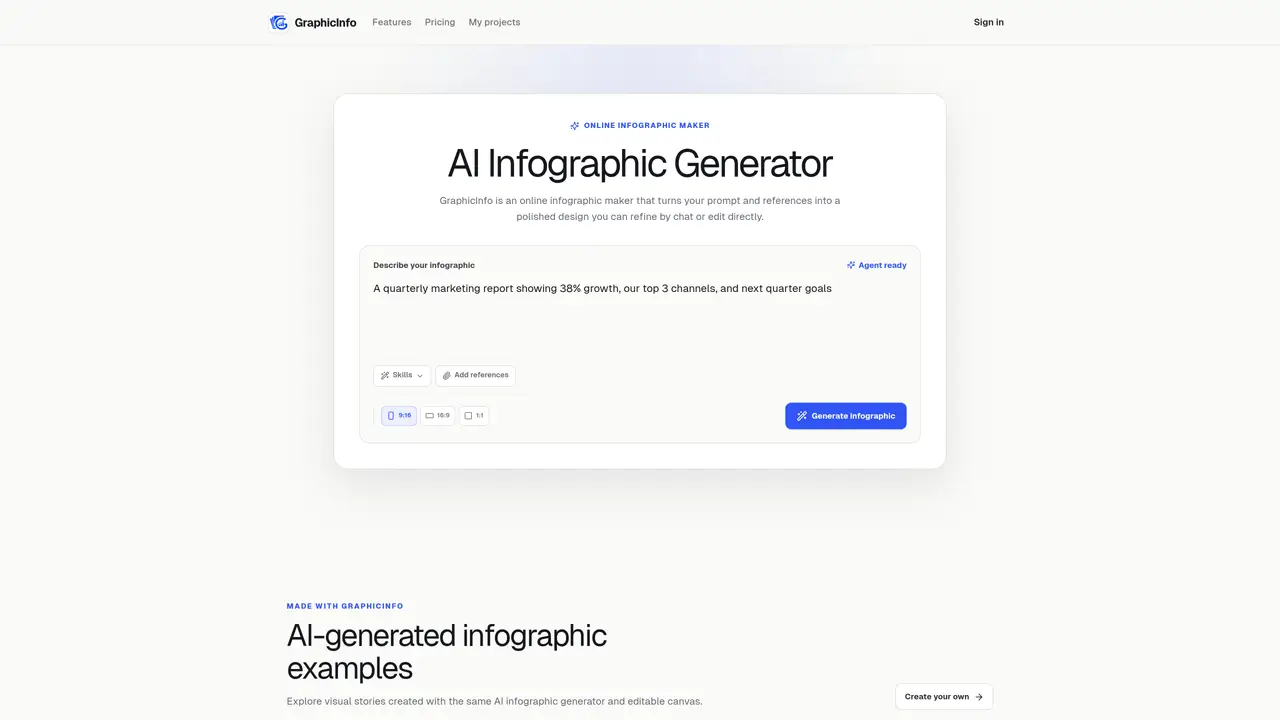
GraphicInfo.cc is an online AI-powered infographic maker that converts written briefs into polished, editable visuals. Users describe their topic, audience, and visual direction, and the AI agent generates a complete HTML infographic with structured storytelling. The tool supports various formats including data reports, timelines, comparisons, and social posts, catering to editorial, marketing, and educational needs. Once generated, infographics can be refined through chat-based revisions or direct edits on the visual canvas, allowing adjustments to text, fonts, colors, and layout. References such as images or text can be uploaded to ensure designs align with source material. The platform emphasizes ease of use, enabling users to move from concept to publishable infographic without requiring advanced design skills. It is designed for content creators, marketers, educators, and businesses seeking to enhance engagement through visually compelling data presentations. The tool also provides multiple export options, making it suitable for both digital and print use.
An AI infographic generator turns a written brief into a designed visual. GraphicInfo creates editable HTML, so you can continue refining the layout with chat or make precise changes on the canvas.
Yes, you can edit AI-generated infographics either through chat-based revisions or by directly editing elements on the visual canvas, including text, fonts, colors, and layout.
Yes, you can upload images or text references and mention them in your prompt so the result reflects your source material.
You can export the finished design as PNG, JPEG, or WebP formats.
Yes, every account starts with a free tier that includes 20,000 lifetime credits. Additional plans with higher credit allowances are available for more extensive use.
Yes, every account starts with 20,000 lifetime credits, which serves as a free trial to explore the tool's capabilities.
graphicinfo.cc · third-party estimates from Similarweb
Last 4 months · grows by one month every month
Share of visits by channel
Share of visits · estimated visits
Image & Design · Sep 2026
Traffic figures are third-party estimates, good for scale and trends; they can differ from a company's own numbers. Updated monthly.
We use essential cookies to run aitoolnavio™, and optional cookies to analyze traffic and measure our marketing. You choose what we use — optional cookies stay off unless you turn them on. See our Privacy Policy.
One short email a week: fresh tools worth trying, honest takes and the updates that actually matter. No spam, unsubscribe any time.
Unleash creativity: edit photos, videos, and designs with AI-enhanced tools.
A drag-and-drop design platform for presentations and social graphics with AI photo tools and a large template library.
Create captivating, customizable presentations and easily share them across devices with a cloud-based platform.
Generate custom visuals for blogs, create unique social media images, and design eye-catching visuals for marketing campaigns.
Create stunning designs, edit photos, remove objects, make collages, and transform images with powerful AI tools and effects.
Create auto-resized campaign images and videos with DaVinci AI's generative media suite.
Create precise 3D models, collaborate on designs, and analyze simulations in real-time.
Cloudinary provides APIs and tools to integrate, manage, and optimize images and videos for AI-driven visual experiences.
Generate custom color palettes instantly with AI or from images for design projects.
Turn simple prompts into flyers, social posts, emails, event pages, and tickets using AI-powered design and marketing tools.
Generate high-quality images with flawless embedded text from text prompts, plus batch output and style control in a creative canvas.
Edit, transform, and enhance photos with text prompts using our free AI photo editor online.
Matched on what this tool does — grouped by the job you would be replacing.
matches AI-powered text summarization · Automatic icon selection · Relevant image sourcing
AI-powered infographic generator that turns prompts into branded, customizable visuals for marketing, reports, and communications.
AI-powered visual communication tool for creating infographics, reports, presentations, and social graphics from templates with AI assistance.
Turns text, data, or images into professional infographics instantly with AI, no design skills required.
Converts text prompts into fully editable infographics