
Generate content, correct spelling, suggest synonyms to enhance writing.

Newton
$11.99/mStarting price
789Monthly visits
0Popularity
About Newton
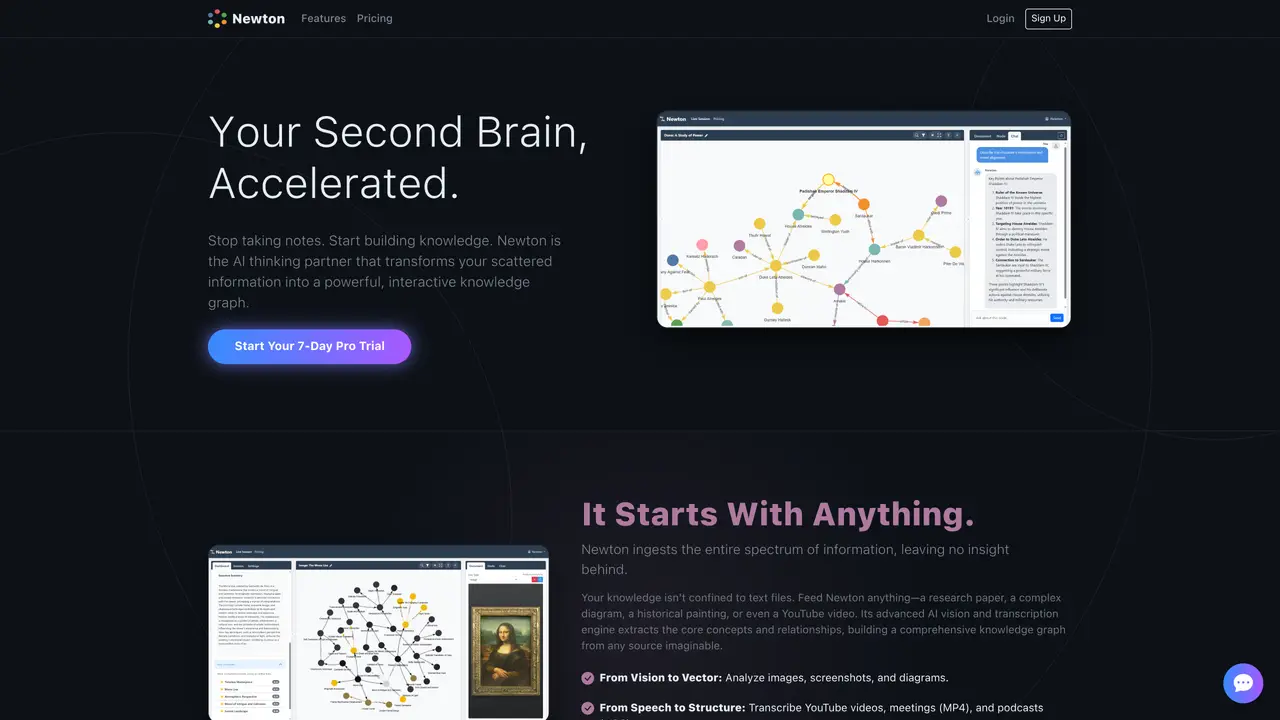
Newton Graph is an AI workspace designed to help users organize ideas visually and enhance learning speed through structured concept mapping. The tool automatically extracts concepts from images, screenshots, and videos, transcribes media content, and graphs conversations from audio files. It is particularly useful for students, researchers, and knowledge workers who need to process complex information efficiently. By converting unstructured data into clear visual representations, Newton Graph enables users to save time and improve comprehension. The platform supports a range of input types, including YouTube videos, screenshots, and audio recordings, making it versatile for different professional and academic needs. Its structured output helps users quickly grasp key insights and relationships within their data. While Newton Graph excels at simplifying information, it may face challenges with highly complex datasets or occasional model accuracy issues, which users should consider for their specific use cases.
Key features
- Extracts concepts from images and screenshots
- Automatically transcribes media content
- Graphs conversations from audio files
- Converts YouTube video content into structured data
- Creates structured notes from unstructured inputs
- Supports visual knowledge mapping for complex information
- Organizes ideas into clear concept maps
- Summarizes audio content for quick insights
Use cases
- Analyze images for concept extraction in research or content creation
- Transcribe and summarize YouTube video conversations for educational or marketing purposes
- Convert screenshots into structured data for reports or documentation
Pros
- Transforms unstructured data (text, images, audio, video) into interactive knowledge graphs for deeper understanding
- Supports diverse input types including YouTube videos, PDFs, GitHub repositories, and audio recordings
- Provides dynamic analysis tools like argument mapping, topic clustering, and shortest path analysis for critical thinking
- Offers specialized modes such as timelines, process flowcharts, and geospatial visualization for varied use cases
- Enables interactive exploration with features like deep dives, idea bubbles, and AI-assisted drafting
Cons
- May struggle with highly complex or ambiguous datasets requiring manual refinement
- Occasional model accuracy issues could impact precision in concept extraction or relationship mapping
- Performance may vary depending on input quality or the clarity of the source material
- Advanced features may require a learning curve for new users to fully utilize
Frequently asked questions about Newton
What does Newton Graph do?
Newton Graph transforms unstructured information—such as text, images, videos, audio files, and code—into interactive knowledge graphs, timelines, argument maps, and flowcharts. It uses AI to extract concepts, relationships, and structure from diverse inputs, enabling users to visualize and analyze their data dynamically.
Who is Newton Graph designed for?
The tool is designed for students, researchers, knowledge workers, and professionals who need to process, organize, and understand complex information efficiently. It suits users who work with multimedia, documents, or collaborative discussions and want to enhance comprehension and critical thinking.
How does Newton Graph handle different types of input?
Newton Graph ingests a wide range of inputs, including YouTube videos, audio recordings, images, screenshots, PDFs, Word documents, PowerPoint presentations, spreadsheets, and code repositories. Its AI vision and transcription engines extract core concepts and relationships from each type, converting them into structured visual representations.
Can Newton Graph help with analyzing arguments or processes?
Yes, Newton Graph includes specialized modes for argument mapping and process flowcharting. The argument mapping mode deconstructs narratives into claims, premises, and evidence, while the process flowchart mode standardizes workflows and visualizes decision branches, actions, and outcomes.
Does Newton Graph support geospatial visualization?
Yes, Newton Graph offers a geospatial mode that plots locations identified in text onto an interactive 3D globe. This feature helps users understand the geographical context of their data, such as historical events, logistical networks, or geopolitical relationships.
How do I get started with Newton Graph?
To get started, users can sign up on the Newton Graph website and begin uploading their content—such as documents, images, or audio/video files. The platform guides users through the process of transforming their input into a structured knowledge graph or other visual representation, with options to explore features like argument mapping or timelines.
Newton Website Engagement
Last Update: 9 days ago
Total Monthly Visits
0
Bounce Rate
0%
Visit Duration (avg)
—
Pages Per Visit
0
Country Rank
—
Unknown
Global Rank
0