
Create stunning visuals, develop ideas with AI-powered tools, and instantly share content without coding or formatting.

Chartbuddy
$20/moStarting price
841Monthly visits
0Popularity
About Chartbuddy
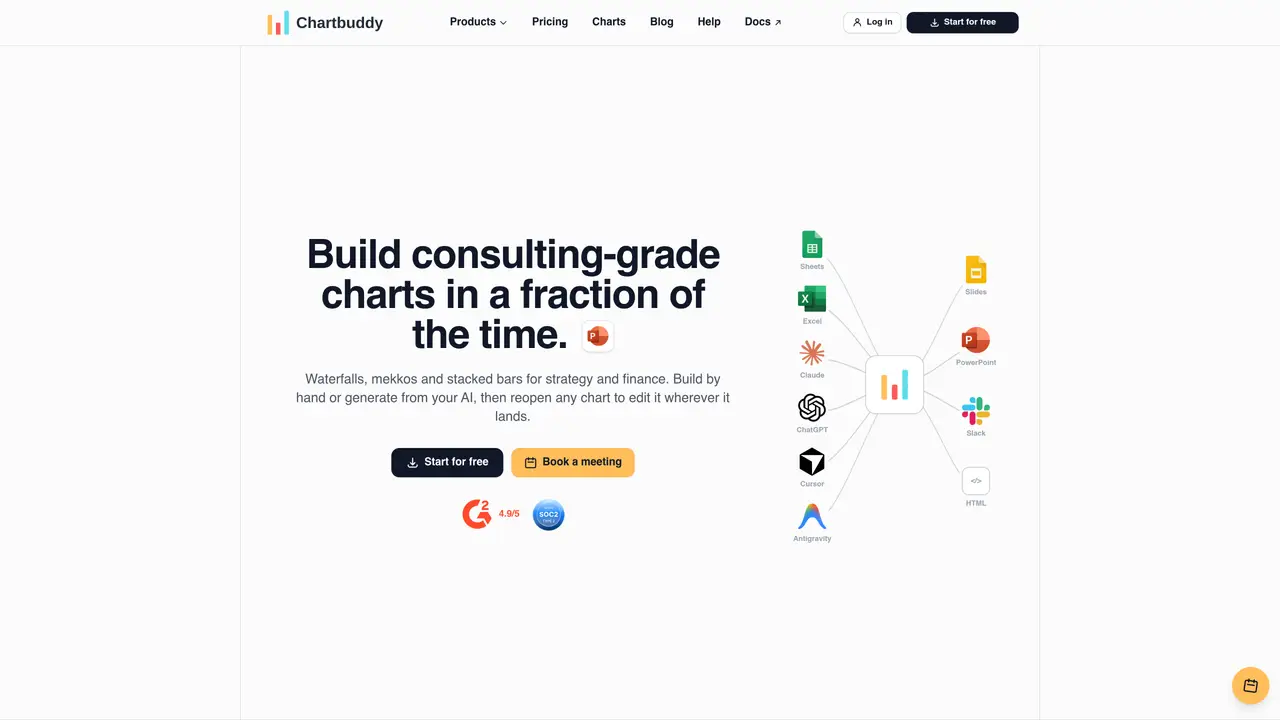
Chartbuddy provides tools to build and edit professional-grade charts such as waterfalls, mekkos, and stacked bars directly within presentation software like PowerPoint and Google Slides. Users can construct charts manually or generate them from AI prompts, then reopen and edit the charts wherever they appear in a deck. The platform supports 14 chart types and allows synchronization with Google Sheets to refresh reports from cell ranges. Charts remain editable after insertion, enabling ongoing adjustments without losing formatting or data connections. The product includes organization-wide color and font controls to ensure consistent styling across all charts. It also offers an AI-powered hub for generating charts from prompts and an embed feature for live, editable HTML charts.
Key features
- Manual chart construction
- AI-generated charts from prompts
- Google Sheets data sync
- 14 chart types including waterfalls and mekkos
- Organization color and font controls
- Editable charts after insertion
- AI-powered chart hub
- HTML embeddable charts
Use cases
- Building financial waterfall charts for investor decks
- Creating mekko charts for market share analysis
- Generating editable dashboards for internal reports
Pros
- Supports 14 chart types including waterfalls and mekkos
- Charts remain editable after insertion into presentations
- Syncs with Google Sheets for report refreshes
- Organization-wide color and font controls for consistency
- AI-powered chart generation from prompts
Cons
- Free tier limited to 10 sessions
- No free tier for team or enterprise features
- Requires PowerPoint or Google Slides integration
Frequently asked questions about Chartbuddy
What is Chartbuddy and what does it do?
Chartbuddy is a tool for building and editing professional-grade charts directly within presentation software like PowerPoint and Google Slides. It supports chart types such as waterfalls, mekkos, and stacked bars, and allows users to create charts manually or generate them from AI prompts.
Who is Chartbuddy designed for?
Chartbuddy is designed for professionals who need to create and maintain high-quality charts for presentations, reports, and dashboards, particularly those in strategy, finance, and consulting roles.
Can Chartbuddy integrate with other tools like Google Sheets or Excel?
Yes, Chartbuddy supports synchronization with Google Sheets to refresh reports from cell ranges, ensuring data remains up-to-date in the charts.
How does Chartbuddy handle chart editing after insertion into a presentation?
Charts created with Chartbuddy remain fully editable after insertion into a presentation, allowing users to adjust formatting or data connections without losing the original structure.
Does Chartbuddy offer AI-powered chart generation?
Yes, Chartbuddy includes an AI-powered hub that allows users to generate charts from prompts, streamlining the chart creation process.
What chart types does Chartbuddy support?
Chartbuddy supports 14 chart types, including waterfalls, mekkos, and stacked bars, among others, catering to a variety of data visualization needs.
Chartbuddy Website Engagement
Last Update: 19 hours ago
Total Monthly Visits
0
Bounce Rate
0%
Visit Duration (avg)
0.00s
Pages Per Visit
0
Country Rank
—
Unknown
Global Rank
0