
Unleash creativity: edit photos, videos, and designs with AI-enhanced tools.

Infogram
$19/mStarting price
580KMonthly visits
46Popularity
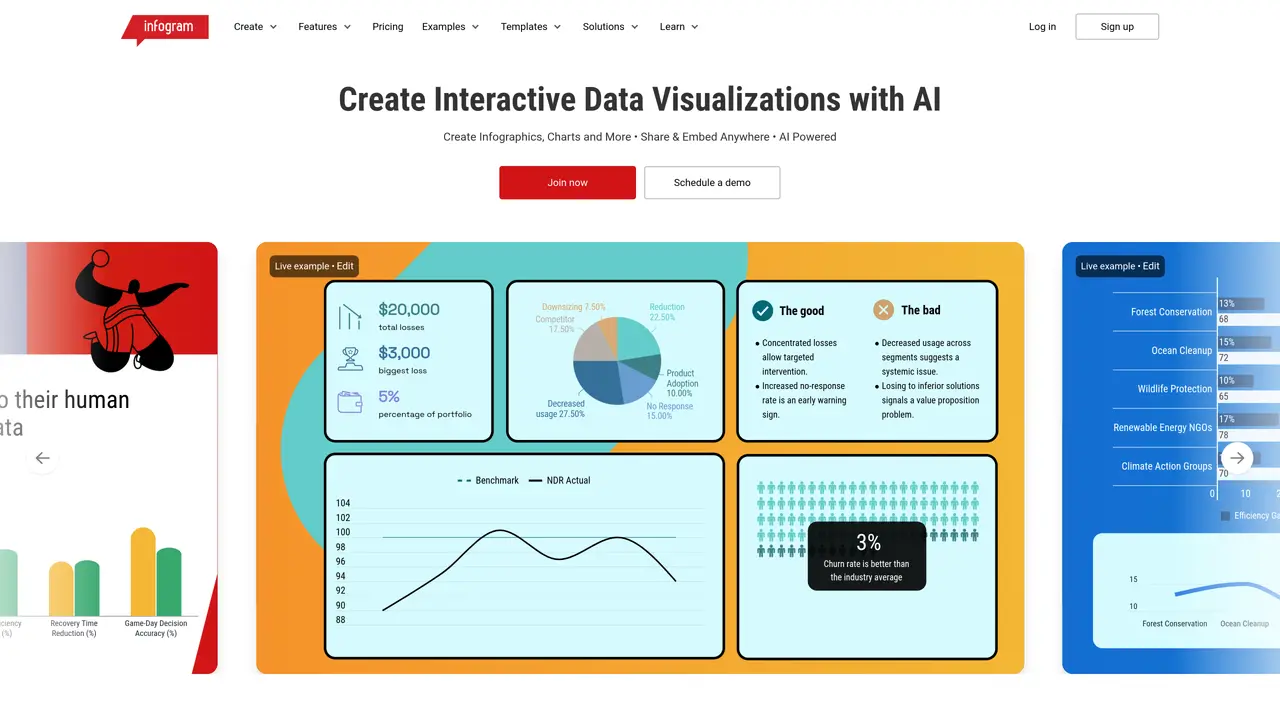
About Infogram
Infogram is a cloud-based data visualization platform designed for individuals, businesses, and organizations. It enables users to create interactive charts, graphs, maps, and timelines from raw data without requiring advanced technical skills. The platform offers a drag-and-drop interface that simplifies the design process, allowing users to customize visuals with themes, colors, and interactive elements. Infograms can be embedded into websites and shared across social media, making them ideal for presentations, reports, and marketing materials. The tool supports real-time collaboration, letting teams work together on the same project simultaneously. Accessible from any device, Infogram ensures that users can manage their data and visuals remotely. It serves professionals in marketing, education, journalism, and corporate communications who need to present data in an engaging and digestible format.
Key features
- Drag-and-drop editor for creating charts, graphs, and infographics
- Interactive visuals with embedded elements
- Real-time team collaboration
- Cloud-based access from any device
- Customizable themes and design options
- Embeddable visuals for websites and social media
- Support for maps, timelines, and complex data visualizations
- No-code platform for non-technical users
Use cases
- Creating interactive reports for business presentations
- Designing infographics for marketing campaigns
- Building data-driven visuals for educational materials
Pros
- Drag-and-drop interface simplifies creation of interactive charts, graphs, maps, and timelines without requiring advanced technical skills
- Supports over 35 customizable chart types and 800+ maps for diverse data visualization needs
- Enables real-time collaboration, allowing teams to work simultaneously on the same project
- Offers AI-powered features such as chart recommendations, data conversion, and content suggestions
- Provides responsive embeds and sharing options for websites, social media, and presentations
Cons
- Advanced features may require a learning curve for users unfamiliar with data visualization tools
- Free version includes watermarks and limited features, which may not suit professional use cases
- Some interactive elements and animations may impact performance on lower-end devices
Infogram videos
Frequently asked questions about Infogram
What types of visualizations can I create with Infogram?
Infogram supports over 35 chart types including pie, line, bar, column, Gantt, bubble, funnel, and dual-axis charts, as well as maps, timelines, infographics, reports, dashboards, slides, posters, and social media graphics.
Who is Infogram designed for?
The platform is designed for professionals in marketing, education, journalism, corporate communications, research, design, and management who need to present data in engaging and digestible formats.
Does Infogram support team collaboration?
Yes, Infogram offers real-time collaboration features, allowing multiple users to work together on the same project simultaneously.
Can I embed Infogram visuals into other platforms?
Yes, Infogram visuals can be easily embedded into websites, blogs, presentations, and shared across social media platforms without requiring coding.
Does Infogram offer AI-powered features?
Yes, Infogram includes AI-powered tools such as chart recommendations, data conversion from images, and content suggestions to streamline the creation process.
Is Infogram accessible and compliant with standards?
Yes, Infogram is WCAG 2.2 Level AA compliant and holds SOC 2 Type 2 certification, ensuring accessibility and data security.
Infogram Website Engagement
Last Update: 9 days ago
Total Monthly Visits
0
Bounce Rate
0%
Visit Duration (avg)
0.00s
Pages Per Visit
0
Country Rank
0
United States
Global Rank
0
Category Rank
#0
Social Sciences
Monthly Traffic
Traffic Sources
Traffic Share By Country
- United States17.5%
- Brazil11.2%
- Germany6%
- Mexico4.3%
- India4.3%