An AI-driven experience management platform for enterprises to collect multi-channel feedback, analyze structured and unstructured data, and deliver actionable insights.

Plotly
$1Starting price
1.1KMonthly visits
1Popularity
About Plotly
Plotly is a data visualization platform that turns datasets into interactive charts and graphs without requiring coding expertise. Users can explore and analyze data in real time through a drag-and-drop interface, generating visuals that reveal patterns and insights. The platform offers extensive customization options, including styling, annotations, and interactive elements, to tailor visuals to specific needs. Plotly supports a wide range of chart types, from basic line and bar graphs to advanced 3D plots and statistical visualizations. Once created, visualizations can be easily shared with teams or embedded in reports, making it ideal for collaborative analysis and presentation. Whether used by data analysts, researchers, or business professionals, Plotly simplifies the process of making data more accessible and actionable. It bridges the gap between raw data and meaningful communication, helping users present findings in a compelling and engaging way.
Plotly
Montreal, Canada · Founded 2013
- Founded
- 2013
- Headquarters
- Montreal, Canada
Key features
- Drag-and-drop interface for quick visualization creation
- Real-time data exploration and analysis
- Wide range of chart types including 3D plots and statistical graphs
- Customization options for styling, annotations, and interactive elements
- Collaborative sharing and embedding of visualizations
- No coding required for basic to intermediate use
- Support for importing data from multiple sources
- Export options for various file formats
Use cases
- Creating interactive dashboards for business performance tracking
- Generating scientific and research visualizations for publications
- Collaborative data analysis and presentation in team settings
Pros
- Supports over 70 chart types with interactive, browser-based visualizations
- Offers open-source libraries (plotly.py, plotly.js, Dash) with stable APIs and extensive documentation
- Enables AI-native analytics through Plotly Studio for agent-assisted data exploration
- Facilitates collaborative sharing and deployment of dashboards and apps via Plotly Cloud
- Provides self-hosted options through Dash Enterprise for secure, on-premises deployment
Cons
- Primarily designed for users with some technical familiarity, especially for advanced customization
- Self-hosted solutions (Dash Enterprise) require infrastructure setup and maintenance
- Free-tier features may be limited compared to paid plans for enterprise needs
Frequently asked questions about Plotly
What is Plotly and who is it designed for?
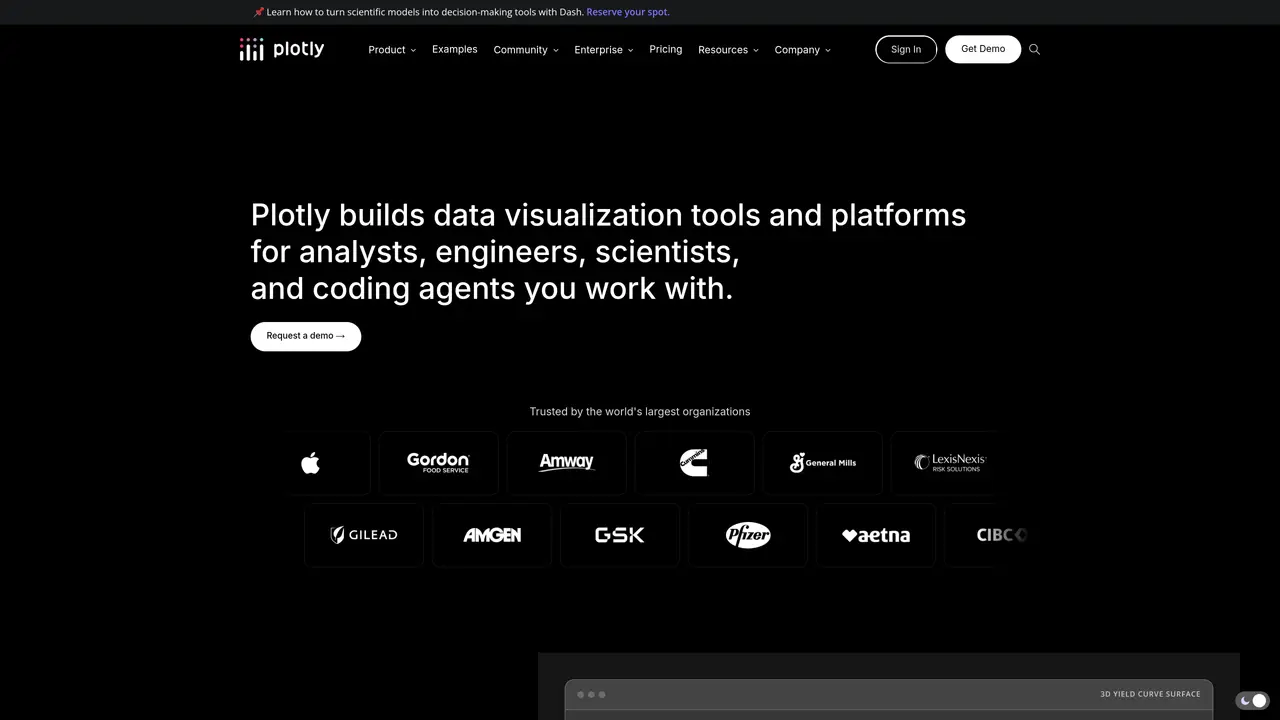
Plotly builds data visualization tools and platforms for analysts, engineers, scientists, and coding agents. It is designed for professionals who need to create interactive charts, dashboards, and analytics apps.
How does Plotly Studio differ from Dash?
Plotly Studio is an AI-native desktop application for data analytics that generates Plotly graphs and Dash apps with verifiable code, while Dash is a Python framework for building interactive analytics apps and dashboards.
Can Plotly visualizations be shared with teams?
Yes, visualizations and apps created with Plotly can be published and shared via Plotly Cloud or deployed behind a firewall using Dash Enterprise, with built-in authentication and collaboration features.
What chart types does Plotly support?
Plotly supports over 70 chart types, including basic line and bar graphs, 3D plots, statistical visualizations, and geospatial maps, all of which are interactive and exportable.
Is Plotly suitable for non-technical users?
Plotly Studio is designed to be accessible to professionals without deep coding expertise, while Dash and the open-source libraries require some technical knowledge for advanced use.
How does Plotly integrate with existing data stacks?
Plotly is built on open-source libraries (plotly.py, plotly.js, Dash) that integrate with existing data workflows, and Dash Enterprise can be deeply integrated into an organization's infrastructure.
Plotly Website Engagement
Last Update: 9 days ago
Total Monthly Visits
0
Bounce Rate
0%
Visit Duration (avg)
0.00s
Pages Per Visit
0
Country Rank
—
Unknown
Global Rank
0