
Create stunning visuals, develop ideas with AI-powered tools, and instantly share content without coding or formatting.

ExcelDashboard AI
FreeStarting price
10KMonthly visits
17Popularity
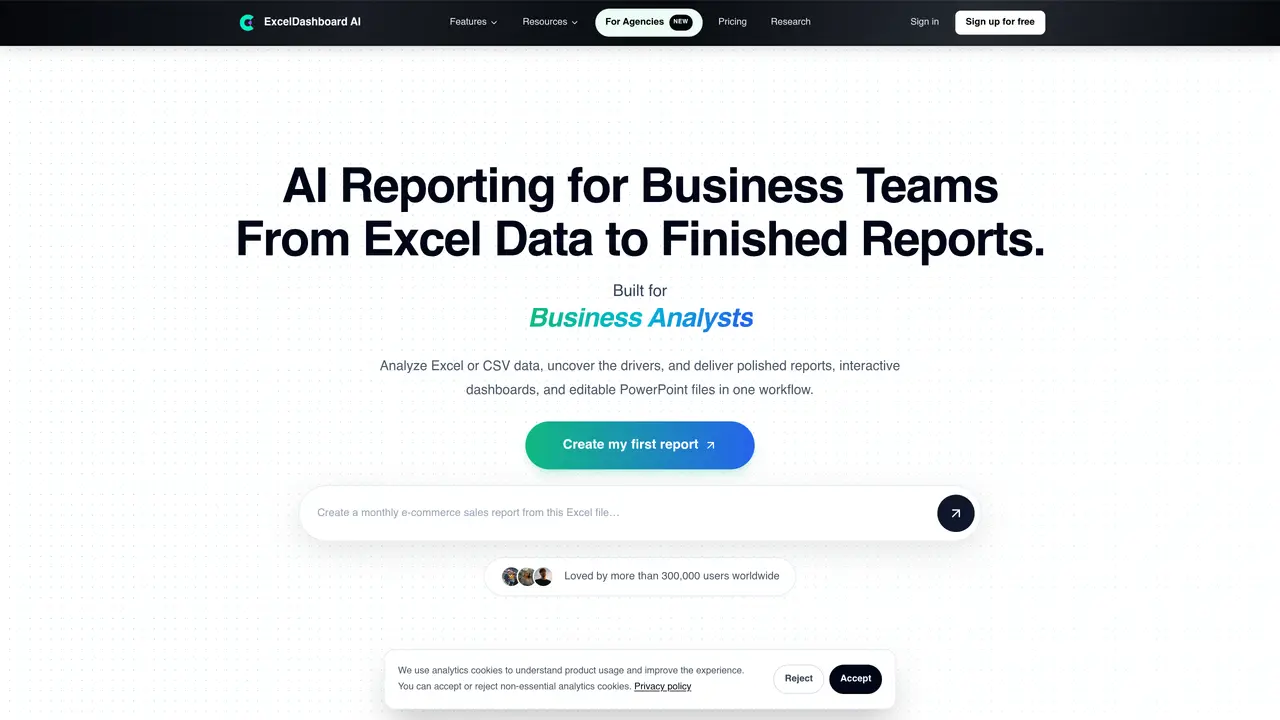
About ExcelDashboard AI
ExcelDashboard AI converts spreadsheet data into structured reports, interactive dashboards, and editable PowerPoint presentations using natural language prompts. The platform supports three primary workflows: AI Data Reports generate charts, executive summaries, insights, and recommendations from Excel or CSV files; AI Excel Dashboards create KPI-focused visualizations for operations and executive reviews; and AI Research Reports synthesize web findings into consulting-style documents with citations. Users can upload files, describe desired outputs, or ask direct questions in plain English to receive grounded answers with supporting metrics and visualizations. The system also handles image-to-chart conversion, text-to-chart generation, and data cleaning without requiring formulas or SQL. Outputs are delivered as editable PowerPoint files, allowing full control over final formatting and branding. The tool is designed for business analysts, agencies, consultants, and reporting teams who need to automate repetitive analysis and presentation tasks while maintaining human oversight.
Key features
- AI Data Reports with charts and executive summaries
- Interactive KPI dashboards generation
- Editable PowerPoint file exports
- Natural language data queries
- Image-to-chart conversion
- Text-to-chart generation
- Data cleaning capabilities
- Recurring report automation
Use cases
- Transforming monthly sales spreadsheets into executive dashboards
- Creating competitive research reports from market data
- Automating client reporting workflows for agencies
Pros
- Converts raw spreadsheet data into polished reports, dashboards, and PowerPoint files
- Supports natural language queries and direct data uploads
- Generates charts, summaries, insights, and recommendations automatically
- Delivers editable outputs for further customization
- Offers image-to-chart and text-to-chart conversion
Cons
- No free tier beyond initial credits
- Monthly credit limits constrain usage on lower plans
- Requires Excel or CSV files as input
- Outputs are PowerPoint-based, limiting format flexibility
Frequently asked questions about ExcelDashboard AI
What types of files can I upload to ExcelDashboard AI?
Users can upload Excel or CSV files to analyze data and generate reports, dashboards, or presentations. The platform also supports image uploads for converting screenshots into editable charts.
Who is ExcelDashboard AI designed for?
The tool is built for business analysts, agencies, consultants, and reporting teams who need to automate repetitive analysis and presentation tasks while maintaining human oversight.
How does ExcelDashboard AI generate reports from data?
Users can describe the report they want, upload data, or ask direct questions in plain English. The AI analyzes the data, creates charts, summaries, insights, and recommendations, and delivers outputs as editable PowerPoint files.
Can ExcelDashboard AI clean data or create charts without formulas?
Yes, the platform handles data cleaning and can generate charts or visualizations directly from user prompts without requiring formulas or SQL knowledge.
What workflows does ExcelDashboard AI support?
The platform supports three primary workflows: AI Data Reports, AI Excel Dashboards, and AI Research Reports. It also offers features like image-to-chart conversion, text-to-chart generation, and data queries.
How do I get started with ExcelDashboard AI?
Users can sign up for free, upload their data or start with a question, and let the AI generate a finished report, dashboard, or presentation. The platform guides users through the process with prompts and examples.
ExcelDashboard AI Website Engagement
Last Update: 9 days ago
Total Monthly Visits
0
Bounce Rate
0%
Visit Duration (avg)
0.00s
Pages Per Visit
0
Country Rank
0
India
Global Rank
0
Category Rank
#0
Programming & Developer Software
Monthly Traffic
Traffic Sources
Traffic Share By Country
- India25.3%
- Indonesia13.8%
- United States13.4%
- Saudi Arabia12.4%
- Egypt12.1%