
Generate content, correct spelling, suggest synonyms to enhance writing.
173M visits/mo+0.1%#1 Productivity & Office

AI-powered platform that turns spreadsheets, APIs and datasets into interactive charts, maps and dashboards without writing code.
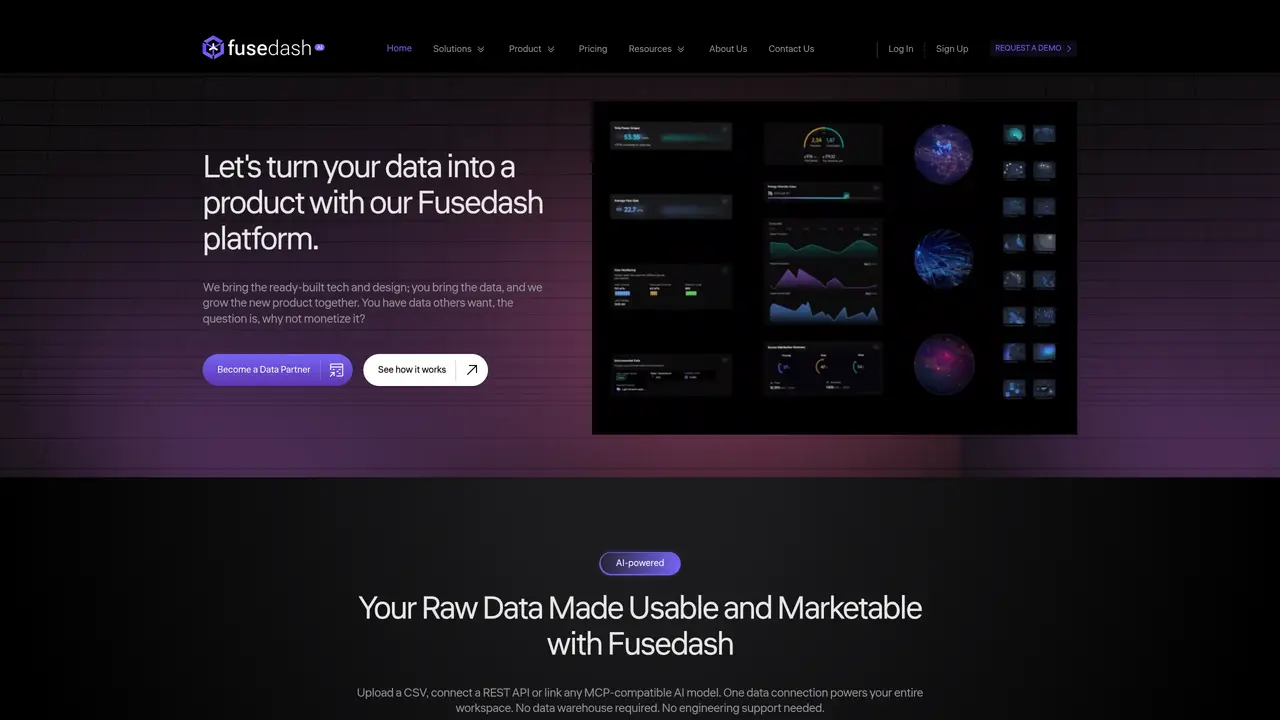
Fusedash is an AI-powered data visualization platform that connects CSVs, APIs, and public datasets to automatically generate charts, maps, dashboards, and real-time KPI views. Its AI chart generator recommends chart types and styling, while a natural-language chat lets users ask questions and receive charts and explanations instantly. Teams can quickly spot trends, build narrative reports, and share actionable, code-free dashboards. The platform is designed for users who need to transform raw data into clear visuals without manual charting or coding. It supports rapid iteration from exploration to presentation, making it suitable for analysts, product managers, and business teams who rely on data-driven decisions. By combining automation with interactive exploration, Fusedash reduces the time spent on repetitive visualization tasks and enables faster insights across organizations.
Fusedash is an AI-powered generative analytics platform that transforms raw data into interactive dashboards, charts, maps, and narrative reports. It allows users to upload data, connect APIs, and ask questions in plain language to generate visualizations and insights without coding.
Fusedash is designed for business leaders, analysts, BI teams, marketing, finance, operations, and agencies who need to create shareable data visualizations and dashboards quickly. It supports roles across industries like e-commerce, SaaS, and retail.
Fusedash uses AI to recommend chart types, generate visualizations from connected data sources, and build interactive dashboards with KPIs, filters, and real-time updates. Users can customize layouts and add storytelling elements without manual charting.
Yes, Fusedash supports real-time data connections through REST APIs and live monitoring dashboards that auto-refresh. It also allows setting alerts for anomalies or changes in metrics.
No, Fusedash does not require a data warehouse or engineering support. Users can upload CSVs, connect REST APIs, or link MCP-compatible AI models directly to power their workspace.
To get started, users can upload a CSV, connect a REST API, or link an MCP-compatible AI model. From there, they can build dashboards, generate charts, and use the AI chat to explore data and create reports.
fusedash.ai · third-party estimates from Similarweb
Last 4 months · grows by one month every month
Share of visits by channel
Share of visits · estimated visits
Productivity & Office · Sep 2026
Traffic figures are third-party estimates, good for scale and trends; they can differ from a company's own numbers. Updated monthly.
We use essential cookies to run aitoolnavio™, and optional cookies to analyze traffic and measure our marketing. You choose what we use — optional cookies stay off unless you turn them on. See our Privacy Policy.
One short email a week: fresh tools worth trying, honest takes and the updates that actually matter. No spam, unsubscribe any time.
Generate content, correct spelling, suggest synonyms to enhance writing.
Turn messy team ideas into actionable plans with Miro's visual workspace.
Leverage analytics, automate tasks, share documents, and coordinate projects.
Integrates AI into Airtable to analyze data, summarize insights, draft content, and automate workflows without prior AI experience.
Cloud accounting software that automates bookkeeping, invoicing, and financial reporting for small and growing businesses.
Streamline teamwork, manage projects, automate tasks efficiently.
Automate code, research, and documents using agents.
AI assistant for safe, reliable productivity with code, collaboration, and integrations.
Create customizable tables, databases, and spreadsheets, share data securely with team members.
Easy-to-use CRM platform that automates lead capturing, prioritizes tasks, and provides sales pipeline analytics for businesses of all sizes.
Transforms thoughts into actions, enhancing productivity and efficiency.
Write & run code in 50+ languages, auto-complete with AI, and code faster with an intuitive interface.
Matched on what this tool does — grouped by the job you would be replacing.
Paid placement · similar tools from listings that support aitoolnavio™
Instant lead response for home-service pros: your phone rings on every new lead, plus 14 days of follow-up
matches Connects to CSVs, APIs, and public datasets · Automatically generates charts, maps, and dashboards · AI-powered chart type and styling recommendations
matches Connects to CSVs, APIs, and public datasets · Automatically generates charts, maps, and dashboards · Natural-language chat for instant chart generation and explanations
matches Automatically generates charts, maps, and dashboards · Code-free dashboard creation and sharing
matches Real-time KPI views and live data updates · Code-free dashboard creation and sharing
Turns 110+ data sources into interactive, plain-English business dashboards with AI analyst Stella.
An AI analytics platform that lets SaaS teams and businesses create dashboards and reports from natural language prompts without SQL.
AI-powered platform that turns spreadsheets and databases into interactive charts, dashboards, and shareable data stories without coding.
An AI data analytics platform that turns spreadsheets and databases into instant analyses, visualizations, forecasts, and shareable reports.
ExcelMatic turns spreadsheets into insights by letting users analyze and visualize Excel data through natural-language chat.
AI-Powered Excel Data Analysis and Visualization
AI-powered platform that turns Excel or CSV data into reports, dashboards and PowerPoint files
AI-assisted data exploration tool that uncovers insights, generates charts and dashboards, and cleans data automatically.
Create interactive charts and graphs, customize visuals, and share data visualizations for collaboration.
Monitor progress, automate data analysis, create and share custom reports securely.
Real-time business dashboards with interactive charts, automated alerts, and centralized data visualization for tracking KPIs.