Create customizable tables, databases, and spreadsheets, share data securely with team members.
26M visits/mo-0.9%#10 Productivity & Office

AI-powered platform that turns spreadsheets and databases into interactive charts, dashboards, and shareable data stories without coding.
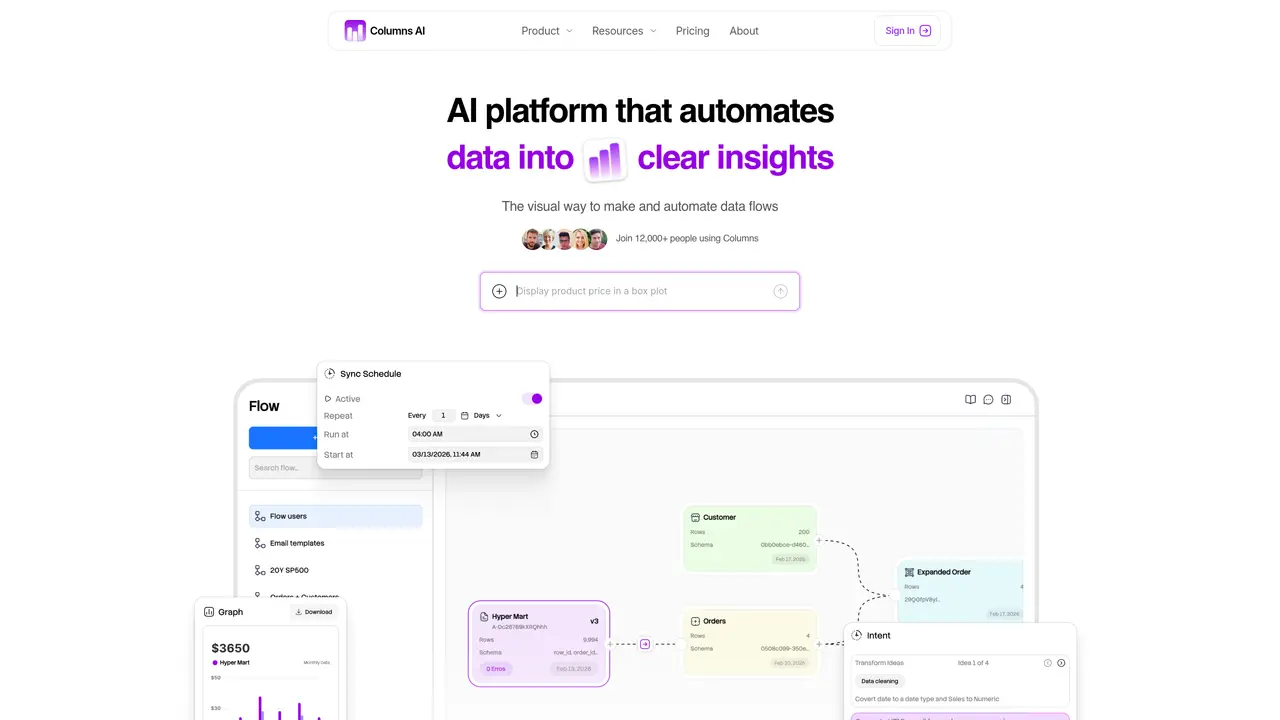
Columns AI is an AI-driven data visualization and storytelling platform that connects directly to live data sources such as spreadsheets and databases. It transforms raw tabular data into polished charts, dashboards, and interactive narratives in minutes, automating the creation process for users without technical expertise. The tool features AI that auto-generates visualizations, suggests layouts and insights, and provides natural-language query builders and design recommendations. Users can assemble interactive data stories and reports that are easy to share and embed. Columns AI is designed for rapid prototyping, collaborative self-serve analytics, and quick updates, making it a practical alternative to traditional business intelligence tools. It offers a free tier to help users get started and supports teams in simplifying data communication and decision-making processes.
Columns AI is an AI-driven platform that transforms raw tabular data into polished charts, dashboards, and interactive narratives by connecting directly to live data sources.
The tool is designed for users without technical expertise, teams needing rapid prototyping, and organizations looking to simplify data communication and decision-making.
Yes, Columns AI connects directly to live data sources such as spreadsheets and databases, enabling real-time updates and insights.
Yes, Columns AI allows users to assemble interactive data stories and reports that can be shared and embedded easily.
Columns AI provides a free tier to help users get started, along with features like natural-language query builders and design recommendations to simplify the process.
columns.ai · third-party estimates from Similarweb
Last 4 months · grows by one month every month
Share of visits by channel
Share of visits · estimated visits
Productivity & Office · Sep 2026
Traffic figures are third-party estimates, good for scale and trends; they can differ from a company's own numbers. Updated monthly.
We use essential cookies to run aitoolnavio™, and optional cookies to analyze traffic and measure our marketing. You choose what we use — optional cookies stay off unless you turn them on. See our Privacy Policy.
One short email a week: fresh tools worth trying, honest takes and the updates that actually matter. No spam, unsubscribe any time.
Create customizable tables, databases, and spreadsheets, share data securely with team members.
Skywork Super Agents: Workspace productivity suite with specialized AI for research-grade documents, slides & spreadsheets + multimedia tools.
AI-powered time tracking platform for teams to log hours, manage timesheets, and generate invoices with automatic and manual tracking options.
Turns CSV, Excel, and PDF files into editable dashboards and reports with AI edits, refresh, and templates.
The AI agent for Excel and Sheets with advanced add-ons for Google Workspace and Microsoft Office.
Automate data cleaning, gain AI-driven insights, and create interactive reports and visualizations.
Transform spreadsheets into AI-powered data analysis tools, simplifying complex insights.
Supercharge Excel for smarter financial planning and analysis.
Automate data entry, connect spreadsheets to databases, APIs, and identify trends with predictive analytics.
Automate complex Excel formulas, generate accurate equations with 44,000+ formulas.
Code-powered spreadsheet tool with Python, SQL, and AI integration.
AI-powered data analyst that turns plain-English questions into charts, tables, code, and automated reports.
Matched on what this tool does — grouped by the job you would be replacing.
matches AI auto-generates visualizations from raw data · Suggests layouts and design recommendations · Creates interactive dashboards and charts
AI analytics platform that turns raw data into interactive, embed-ready customer reports using plain-English queries.
An agentic AI data platform that lets business teams analyze and visualize data through natural language chat, with automated dashboards and reports.
AI-powered platform that turns spreadsheets, APIs and datasets into interactive charts, maps and dashboards without writing code.
An AI data analytics platform that turns spreadsheets and databases into instant analyses, visualizations, forecasts, and shareable reports.
matches Natural-language query builder for easy data exploration · Connects to live data sources like spreadsheets and databases · Supports rapid prototyping and collaborative analytics
AI tool that turns scattered business data into actionable reports
No-code analytics platform that turns plain-English questions into SQL queries and auto-generates visualizations for business insights.
An AI database assistant that lets business teams query live data, build dashboards, and trigger alerts without writing SQL.
Analyze databases and spreadsheets by typing natural-language prompts to extract insights without technical skills.