An AI-driven experience management platform for enterprises to collect multi-channel feedback, analyze structured and unstructured data, and deliver actionable insights.

Bricks
$17.50Starting price
236KMonthly visits
40Popularity
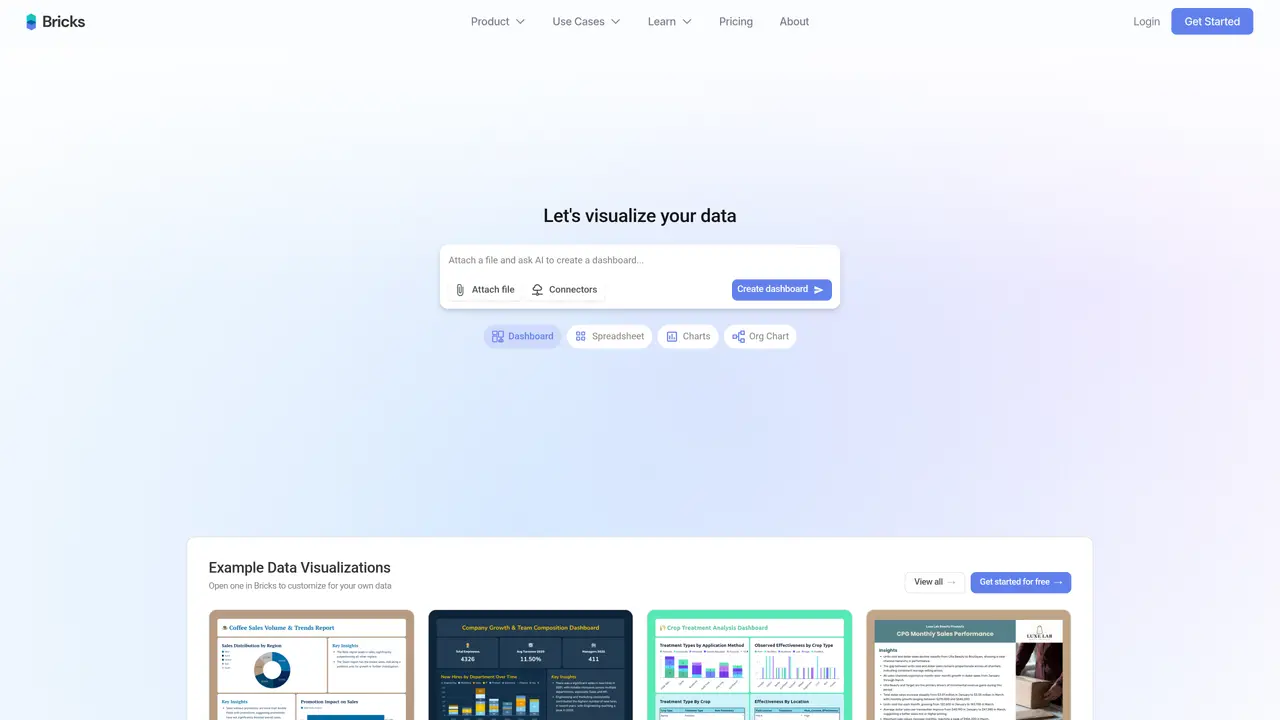
About Bricks
Bricks is a web-based AI data analyst designed for professionals, consultants, marketers, analysts, and teams who need dashboards and reports from CSV, Excel, or PDF files without setup. It generates charts, tables, and insights from uploaded files in seconds, producing instant AI dashboards and reports. Users can edit layouts through drag-and-drop controls or natural language AI edits to modify dashboard elements. The tool supports one-click data refresh to regenerate visuals from updated data while preserving the existing layout. Interactive filtering allows users to explore segments and drill into results by clicking data points. Bricks is positioned as a simpler alternative to tools like Tableau and Power BI, offering BI-style dashboards with design-friendly editing. It includes templates, themes, and the ability to import data from Google Sheets or databases for repeatable reporting workflows.
Key features
- Instant AI dashboards and reports from CSV, Excel, or PDF files
- Editable layouts with drag-and-drop or natural language AI edits
- One-click data refresh to regenerate visuals from updated data
- Interactive filtering by clicking data points
- Templates and themes for repeatable reporting
- Imports from Google Sheets or databases
- Freemium pricing with AI message limits
- Team and enterprise plans with custom pricing
Use cases
- Automating reports for business analysts
- Creating editable dashboards from spreadsheets
- Generating insights from PDF files for consultants
Pros
- Generates dashboards and reports from CSV, Excel, or PDF files in seconds
- Supports drag-and-drop and natural language AI edits for dashboard customization
- Enables one-click data refresh to regenerate visuals while preserving layout
- Offers interactive filtering to explore data segments and drill into results
- Provides professional themes and templates for design-friendly dashboards
Cons
- Limited advanced analytics capabilities compared to enterprise BI tools
- May not handle extremely large or complex datasets as efficiently as specialized tools
- Requires data to be uploaded in supported formats (CSV, Excel, PDF, Google Sheets)
- Dependent on user-uploaded data quality for accurate insights and visualizations
Frequently asked questions about Bricks
What is Bricks and what does it do?
Bricks is a web-based AI data analyst that transforms CSV, Excel, or PDF files into interactive dashboards and reports in seconds. It generates charts, tables, and insights automatically, allowing users to create, edit, and refresh visualizations without manual setup or advanced technical skills.
Who should use Bricks?
Bricks is designed for professionals across industries such as finance, marketing, healthcare, education, retail, and operations, as well as teams of all sizes from startups to enterprises. It suits users who need quick, professional reports without relying on IT or data teams.
How does Bricks handle data updates and dashboard refreshes?
Bricks offers one-click dashboard refreshes, regenerating all charts and visuals from updated data while preserving the existing layout. Users can upload new data files or connect to sources like Google Sheets or databases to automate repeatable reporting workflows.
Can Bricks edit dashboards using natural language?
Yes, Bricks allows users to edit dashboard elements through natural language AI commands, enabling quick modifications without manual drag-and-drop adjustments. This feature supports both layout changes and data transformations.
What types of visualizations does Bricks support?
Bricks supports a variety of visualizations including charts, graphs, spreadsheets, org charts, US geo maps, heatmaps, treemaps, Sankey diagrams, funnels, combo charts, scatter plots, and donut charts. Users can customize these visuals to fit their reporting needs.
Does Bricks integrate with other tools or data sources?
Bricks allows users to import data from Google Sheets or databases, enabling seamless integration with existing workflows. It also supports direct file uploads from CSV, Excel, or PDF formats for quick dashboard creation.
Bricks Website Engagement
Last Update: 9 days ago
Total Monthly Visits
0
Bounce Rate
0%
Visit Duration (avg)
0.00s
Pages Per Visit
0
Country Rank
0
United States
Global Rank
0
Category Rank
#0
Programming & Developer Software
Monthly Traffic
Traffic Sources
Traffic Share By Country
- United States33.8%
- Canada7%
- United Kingdom6.3%
- India5.8%
- Philippines3.2%