
Generate captions, optimize content, and enhance with custom images for maximum engagement.
46M visits/mo-10%#3 Image & Design

Turns 110+ data sources into interactive, plain-English business dashboards with AI analyst Stella.
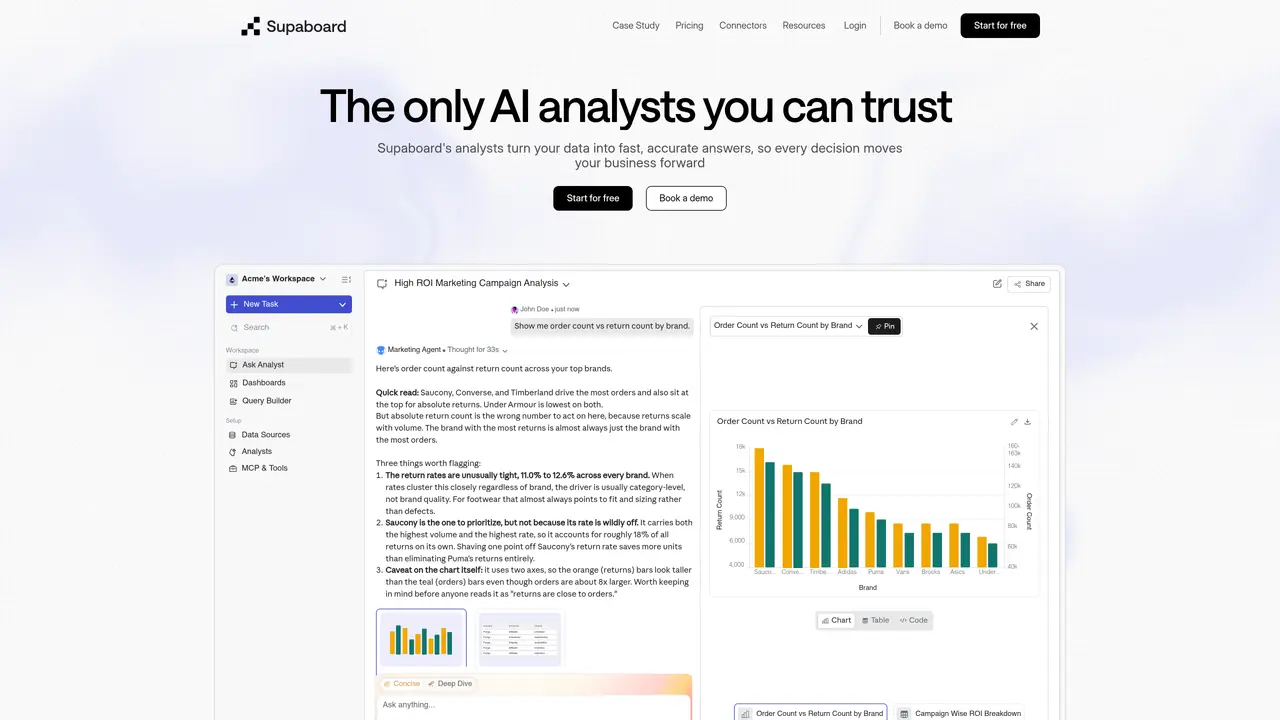
Supaboard AI connects to more than 110 data sources and transforms them into interactive dashboards that can be queried using plain English. Its built-in AI analyst, Stella, performs trend detection, anomaly spotting, predictions, and root cause analysis across sales, finance, product, and growth data. Users can describe the visualizations they want without writing SQL, and the platform builds them automatically. The tool is designed for teams that need to consolidate multiple data streams into a single, real-time view. It supports embedding analytics into applications and customer portals, making it useful for both internal reporting and external-facing insights. Supaboard AI targets data analysts, business executives, marketing teams, product managers, and SaaS companies looking to streamline their analytics workflows.
Supaboard AI is an analytics platform that connects to over 110 data sources and transforms them into interactive dashboards. Users can query these dashboards using plain English, and the platform's built-in AI analyst, Stella, performs trend detection, anomaly spotting, predictions, and root cause analysis.
The tool is designed for data analysts, business executives, marketing teams, product managers, and SaaS companies who need to consolidate multiple data streams into a single, real-time view and streamline their analytics workflows.
Users describe the visualizations they want in plain English, and the platform automatically builds them without requiring SQL. The AI analyst Stella assists by interpreting queries and generating insights.
Yes, Supaboard AI supports embedding analytics into applications and customer portals, making it useful for both internal reporting and external-facing insights.
Stella performs trend detection, anomaly spotting, predictions, and root cause analysis across sales, finance, product, and growth data.
Users can start for free or book a demo to explore the platform's capabilities. The setup involves connecting data sources and using the AI analyst to query and visualize data.
supaboard.ai · third-party estimates from Similarweb
Last 4 months · grows by one month every month
Share of visits · estimated visits
Other countries: 8.4%
Automation & Agents · Sep 2026
Traffic figures are third-party estimates, good for scale and trends; they can differ from a company's own numbers. Updated monthly.
We use essential cookies to run aitoolnavio™, and optional cookies to analyze traffic and measure our marketing. You choose what we use — optional cookies stay off unless you turn them on. See our Privacy Policy.
One short email a week: fresh tools worth trying, honest takes and the updates that actually matter. No spam, unsubscribe any time.
Generate captions, optimize content, and enhance with custom images for maximum engagement.
Build conversational forms, capture rich responses, and automate follow-ups with AI-powered surveys and workflows.
Automate code, research, and documents using agents.
AI-powered IDE for autonomous coding tasks and agentic development workflows
Source, match, and manage talent with predictive analytics for effortless recruiting.
Automate workflow, optimize operations, and detect potential issues with this efficient AI-driven solution.
Transforms thoughts into actions, enhancing productivity and efficiency.
AI Recruitment engine to hire top global talent
All-in-one team productivity platform combining chat, docs, video meetings, workflows, and AI tools in one place.
Personal assistant that coordinates tasks across apps and devices via text or call
AI automation and agent-building platform with 3,000+ app integrations
AI job search copilot that matches roles to skills, optimizes resumes for ATS, generates cover letters, and autofills applications with real-time insights.
Matched on what this tool does — grouped by the job you would be replacing.
matches Natural language querying for dashboards · No-code dashboard creation · Stella AI analyst for automated insights
Always-on AI business intelligence that connects to data sources to generate interactive dashboards and prioritized insights without coding.
An AI analytics platform that lets SaaS teams and businesses create dashboards and reports from natural language prompts without SQL.
An agentic AI data platform that lets business teams analyze and visualize data through natural language chat, with automated dashboards and reports.
AI-powered platform that turns spreadsheets, APIs and datasets into interactive charts, maps and dashboards without writing code.
matches AI-driven trend detection and anomaly spotting · Predictive analytics and root cause analysis
Unified AI-powered platform for real-time monitoring, analytics, and security across cloud infrastructure, applications, and services.
AI-powered platform for full-stack observability, anomaly detection, and automated root cause analysis without coding.
A powerful tool for optimizing and accelerating data analytics with intelligent query optimization and performance tuning.