
Create stunning visuals, develop ideas with AI-powered tools, and instantly share content without coding or formatting.

ChartBrick
FreeStarting price
474Monthly visits
0Popularity
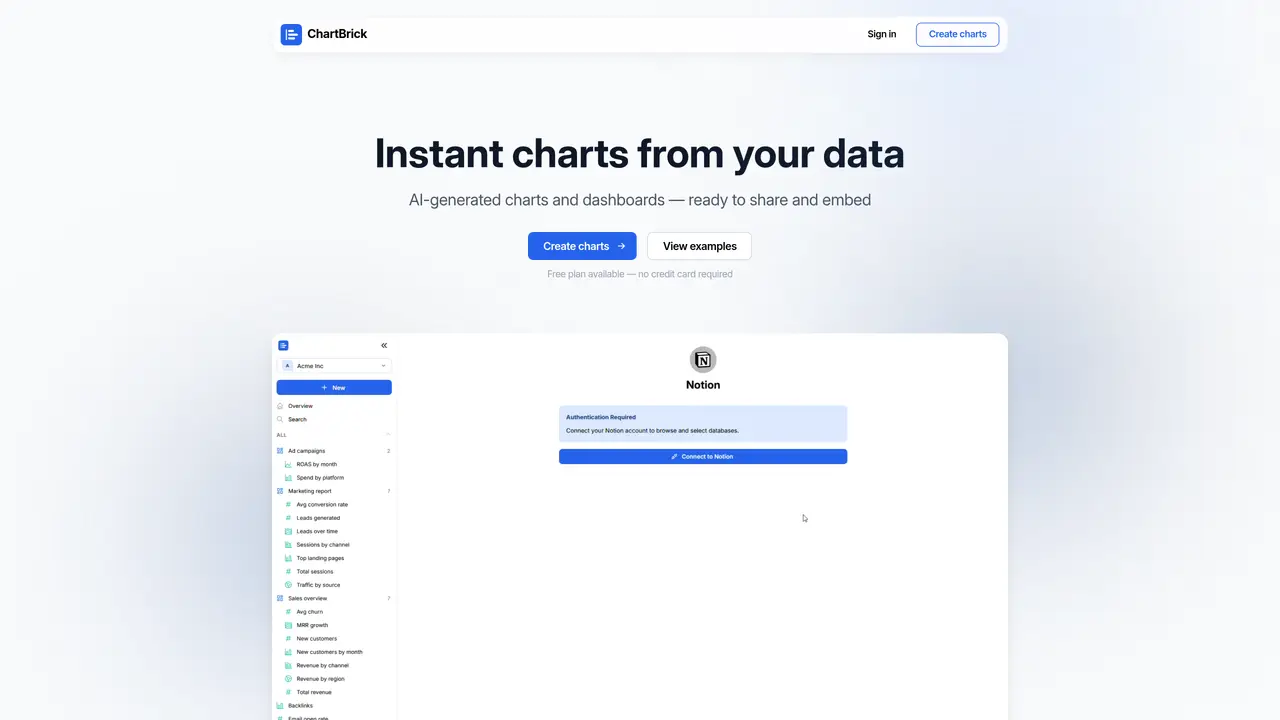
About ChartBrick
ChartBrick is a powerful, user-friendly platform for data visualisation and analysis. With ChartBrick, you can easily and quickly create stunning, interactive charts and data visualisations from your raw data. Whether you’re a professional data analyst, a student, or a non-technical user, you can quickly and easily understand your data and uncover insights.ChartBrick features an intuitive drag-and-drop chart builder, with the ability to customise your charts’ look and feel. You can also access a library of pre-made templates and colour schemes to make your data look even more visually appealing. With ChartBrick, you can quickly and easily adjust chart settings and parameters and share your visualisations with others.ChartBrick is the perfect tool for anyone looking to make their data more accessible and visually engaging. It’s ideal for business professionals, students, and data enthusiasts who want to easily analyse their data and uncover insights.
Key features
- Create interactive charts
- Customize chart appearance
- Access library of templates and color schemes
- Drag-and-drop chart builder
- Adjust chart settings and parameters
- Share visualisations with others
Use cases
- Business professionals who want to make their data more accessible and visually engaging
- Students who need to easily analyse and understand their data
- Data enthusiasts who want to uncover insights from their raw data
Pros
- Supports direct data connections from Notion, Airtable, Google Sheets, Stackby, Postgres, MySQL, Excel, CSV, JSON, and REST API
- Offers AI-generated charts and dashboards with automatic chart type selection and no coding required
- Provides embeddable, auto-updating charts that integrate seamlessly into Notion, websites, or other platforms
- Ensures data privacy with encryption at rest and no sharing with third parties
- Includes a free plan with no credit card required and supports over 20 chart types
Cons
- Limited advanced customization options compared to specialized data visualization tools
- Dependent on third-party data sources, which may introduce latency or connectivity issues
- Free plan may have restrictions on features or usage limits
Frequently asked questions about ChartBrick
What data sources can ChartBrick connect to?
ChartBrick supports direct connections to Notion, Airtable, Google Sheets, Stackby, Postgres, MySQL, Excel, CSV, JSON, and REST API.
Does ChartBrick require coding knowledge to use?
No, ChartBrick is designed for users without coding skills, offering an intuitive drag-and-drop interface and AI-generated charts.
Can I embed charts created with ChartBrick into other platforms?
Yes, charts can be embedded into Notion, websites, or shared via a public link, and they auto-update with live data.
Is there a free plan available for ChartBrick?
Yes, ChartBrick offers a free plan that does not require a credit card.
How does ChartBrick handle data privacy?
All data, including datasets and credentials, is encrypted at rest, and ChartBrick does not sell data to third parties.
What types of charts can I create with ChartBrick?
ChartBrick includes over 20 chart types such as bar, line, pie, donut, area, scatter, heatmap, waterfall, radar, and funnel.
ChartBrick Website Engagement
Last Update: 9 days ago
Total Monthly Visits
0
Bounce Rate
0%
Visit Duration (avg)
0.00s
Pages Per Visit
0
Country Rank
—
Unknown
Global Rank
0