An AI-driven experience management platform for enterprises to collect multi-channel feedback, analyze structured and unstructured data, and deliver actionable insights.

ChartPixel
$15/mStarting price
3.8KMonthly visits
10Popularity
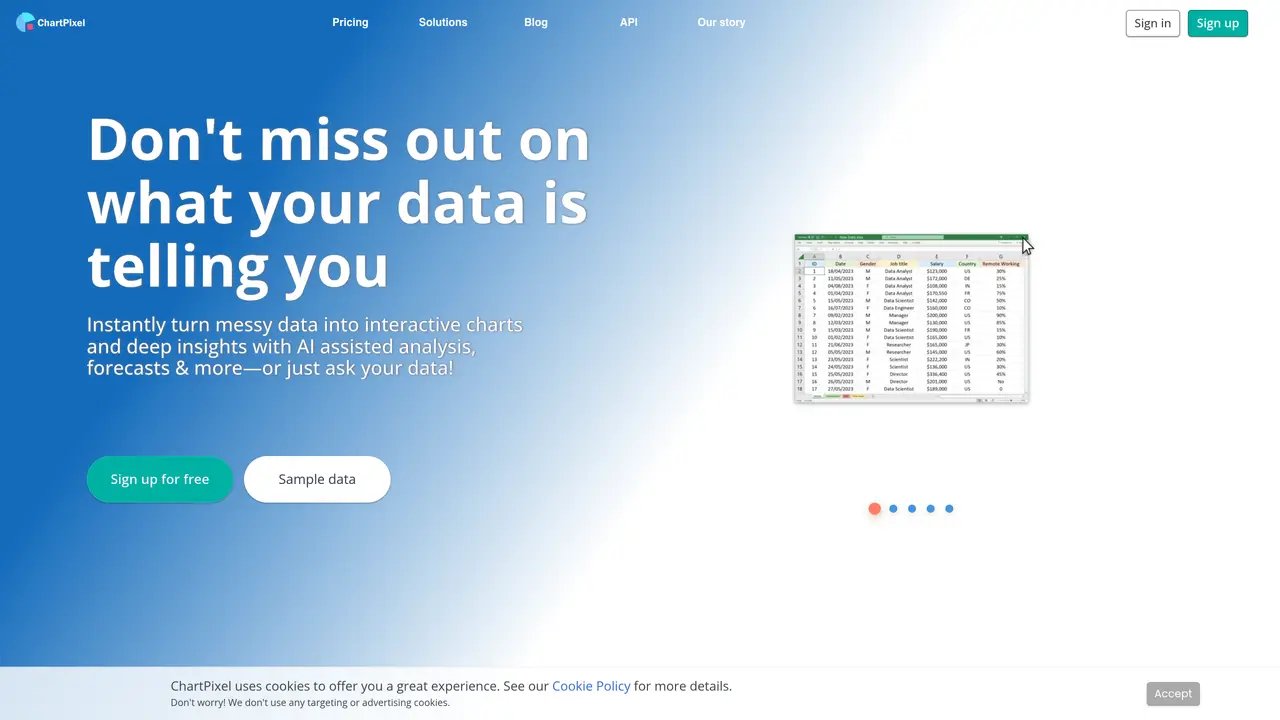
About ChartPixel
ChartPixel is an innovative AI-powered tool that transforms the way we interact with data. In the digital age, where data is the new currency, ChartPixel stands out as a beacon for those looking to harness the power of their data quickly and effectively. It promises to generate charts and insights within a mere 30 seconds, offering a streamlined solution for data visualization and analysis. Designed for a wide array of users, from students to seasoned professionals, ChartPixel aims to simplify the often complex process of data interpretation. Key Features: AI-Assisted Chart Creation: ChartPixel uses artificial intelligence to automatically select the most relevant data columns and chart types, providing meaningful visualizations with minimal user input. User-Friendly Interface: The platform boasts an intuitive interface that caters to users of all skill levels, ensuring that data analysis is accessible and not daunting. Smart Data Cleaning: It takes the hassle out of preprocessing by cleaning messy data and engineering new features for a comprehensive analysis. Insightful Annotations: With AI-assisted annotations and statistics, ChartPixel not only presents data visually but also explains it, making patterns and trends easier to grasp. Versatile Data Input Options: ChartPixel allows users to upload data from various sources, including Excel, CSV files, and even directly from webpages via keyword searches or URLs.
Key features
- AI-Assisted Chart Creation
- User-Friendly Interface
- Smart Data Cleaning
- Insightful Annotations
- Versatile Data Input Options
- Time-Saving
- Educational Tool
- Presentation-Ready Output
- No Data Expertise Required
Use cases
- Students and Educators: Utilizing the tool to learn and teach data analysis without prior coding knowledge.
- Business Analysts: Employing ChartPixel to quickly translate business data into actionable insights.
- Researchers: Leveraging the platform's robust statistical methods for academic studies.
Pros
- AI-assisted chart creation with automatic selection of relevant data columns and chart types
- User-friendly interface designed for all skill levels, from beginners to professionals
- Smart data cleaning and preprocessing to handle messy datasets
- Provides insightful annotations, statistics, and explanations alongside visualizations
- Supports multiple data input options including Excel, CSV, webpages, and keyword searches
Cons
- Limited advanced customization options for highly specialized chart types
- No explicit support for real-time or streaming data sources
- Some features, such as database links and advanced forecasts, are marked as 'coming soon'
- Relies on AI for insights, which may occasionally produce less accurate or contextually relevant results
Frequently asked questions about ChartPixel
What is ChartPixel and what does it do?
ChartPixel is an AI-powered data analysis and visualization platform that transforms raw data into interactive charts, insights, forecasts, and statistical tests. It allows users to upload data from files or web sources, clean and analyze it automatically, and generate actionable visualizations with explanations.
Who is ChartPixel designed for?
ChartPixel is designed for users of all skill levels, from beginners to professionals, including researchers, business analysts, students, and data enthusiasts. Its intuitive interface and guided exploration make data analysis accessible without requiring advanced technical knowledge.
How does ChartPixel ensure the reliability of its AI-generated insights?
ChartPixel blends AI with domain expertise to produce reliable outputs, avoiding the use of raw data in external LLMs. The platform does not train on user data or send it to third-party models, ensuring trustworthy and consistent results for analysis and visualization.
Can I interact with my data directly on ChartPixel?
Yes, ChartPixel allows users to chat with their data and charts, enabling AI-driven queries to uncover key information and trends. This feature helps users explore their data dynamically and extract deeper insights beyond static visualizations.
What types of data can I upload to ChartPixel?
Users can upload data from Excel or CSV files, extract tables from webpages, or use keyword searches and URLs to source data. The platform supports a variety of data formats and sources to accommodate different user needs.
How can I get started with ChartPixel?
Users can sign up for a free account on ChartPixel's website to access sample data, tutorials, and basic features. The platform offers a guided process for uploading data, generating charts, and exploring insights without requiring prior setup or configuration.
ChartPixel Website Engagement
Last Update: 9 days ago
Total Monthly Visits
0
Bounce Rate
0%
Visit Duration (avg)
0.00s
Pages Per Visit
0
Country Rank
0
India
Global Rank
0
Category Rank
#0
Programming & Developer Software
Monthly Traffic
Traffic Sources
Traffic Share By Country
- India72%
- United States28%