An AI-driven experience management platform for enterprises to collect multi-channel feedback, analyze structured and unstructured data, and deliver actionable insights.

SAS Visual Analytics
0Popularity
About SAS Visual Analytics
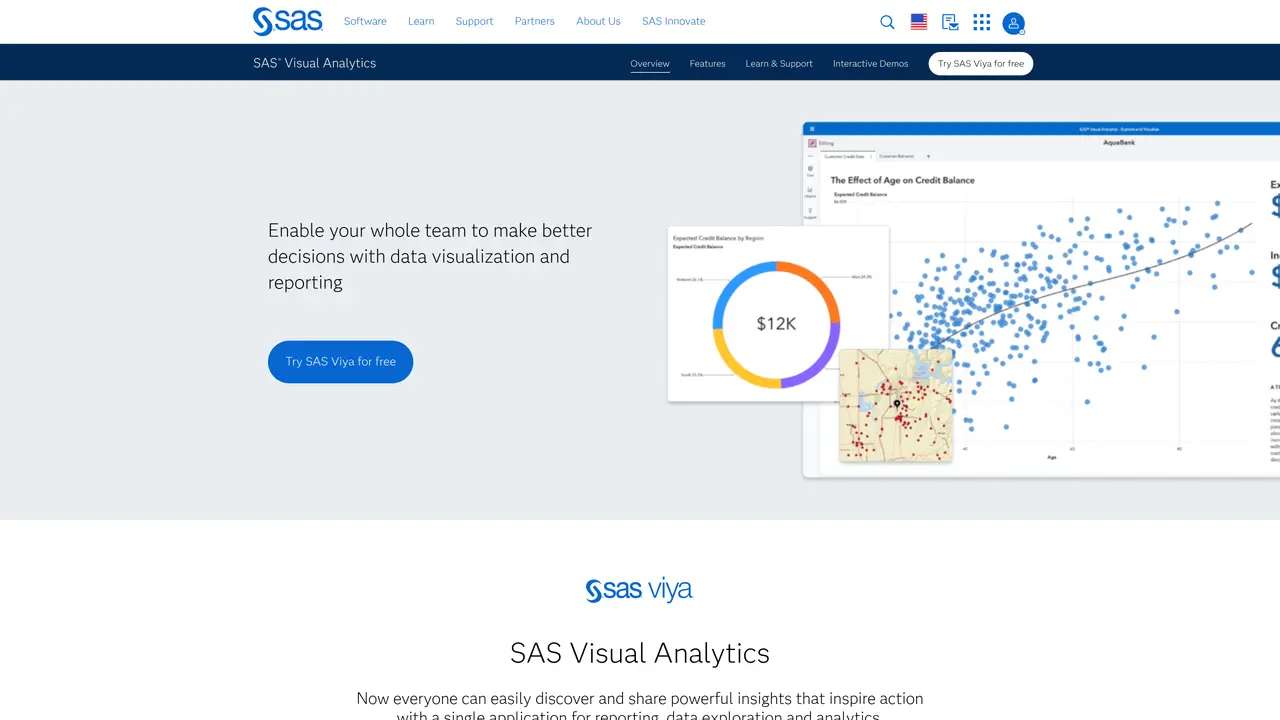
SAS Visual Analytics is an intuitive, cloud-based data exploration and visualization tool that allows users to explore large datasets quickly and easily. With its user-friendly interface and powerful features, this software makes it easy to develop and analyze insights from your data. With SAS Visual Analytics, you can quickly uncover patterns, trends, and relationships among your data points, making it easier to develop meaningful conclusions. The software also allows you to create visually appealing dashboards that tell the story of your data and provide insights in an engaging and informative way. With its easy-to-use drag-and-drop functionality, you can customize your visualizations to suit your needs and share them with colleagues to collaborate more effectively. SAS Visual Analytics is the perfect tool for any business looking to quickly and easily gain insights from their data.
SAS Institute
Cary, United States · Founded 1976
- Founders
- Anthony James Barr, James Goodnight, John Sall, Jane Helwig
- Founded
- 1976
- Headquarters
- Cary, United States
Key features
- Intuitive cloud-based data exploration
- User-friendly interface
- Powerful features for data analysis
- Quickly uncover patterns, trends, and relationships in data
- Create visually appealing dashboards
- Customize visualizations to suit individual needs
Use cases
- Businesses looking to quickly gain insights from their data
- Data analysts seeking to explore large datasets easily
- Organizations wanting to create engaging and informative dashboards
Pros
- Enables self-service data exploration and visualization for non-technical users
- Integrates machine learning and natural language explanations to simplify insight discovery
- Supports interactive reports and dashboards accessible via web and mobile devices
- Facilitates collaboration through shared visualizations and insights
- Provides automated suggestions for identifying key relationships and outliers in data
Cons
- May require training for users unfamiliar with data analytics workflows
- Limited customization options for advanced users compared to specialized tools
- Dependency on SAS ecosystem for full functionality and support
Frequently asked questions about SAS Visual Analytics
What is SAS Visual Analytics?
SAS Visual Analytics is a single application for reporting, data exploration, and analytics that enables users to discover and share insights through data visualization and reporting. It supports interactive reports, dashboards, and machine learning-driven insights.
Who should use SAS Visual Analytics?
The tool is designed for organizations and teams that need to analyze large datasets, create visualizations, and share insights across departments. It suits business analysts, executives, and front-line staff who require self-service data exploration.
How does SAS Visual Analytics work?
It allows users to quickly spot relationships in data using automated suggestions, machine learning, and natural language explanations. Insights can be visualized, narrated, and shared via interactive reports and dashboards accessible on web and mobile devices.
Can SAS Visual Analytics integrate with other tools?
SAS Visual Analytics is part of the SAS Viya platform, which supports integration with various data sources and enterprise systems. It is designed to work within the broader SAS ecosystem for seamless data management and analytics workflows.
What are the key features of SAS Visual Analytics?
Key features include automated relationship detection, dynamic visualizations, interactive dashboards, machine learning-driven insights, natural language explanations, and collaborative sharing capabilities across teams.
How do I get started with SAS Visual Analytics?
Users can try SAS Visual Analytics for free through the SAS Viya platform trial. The platform offers documentation, training resources, and interactive demos to help users begin exploring and analyzing their data.