An AI-driven experience management platform for enterprises to collect multi-channel feedback, analyze structured and unstructured data, and deliver actionable insights.

Threadfisher
0Popularity
About Threadfisher
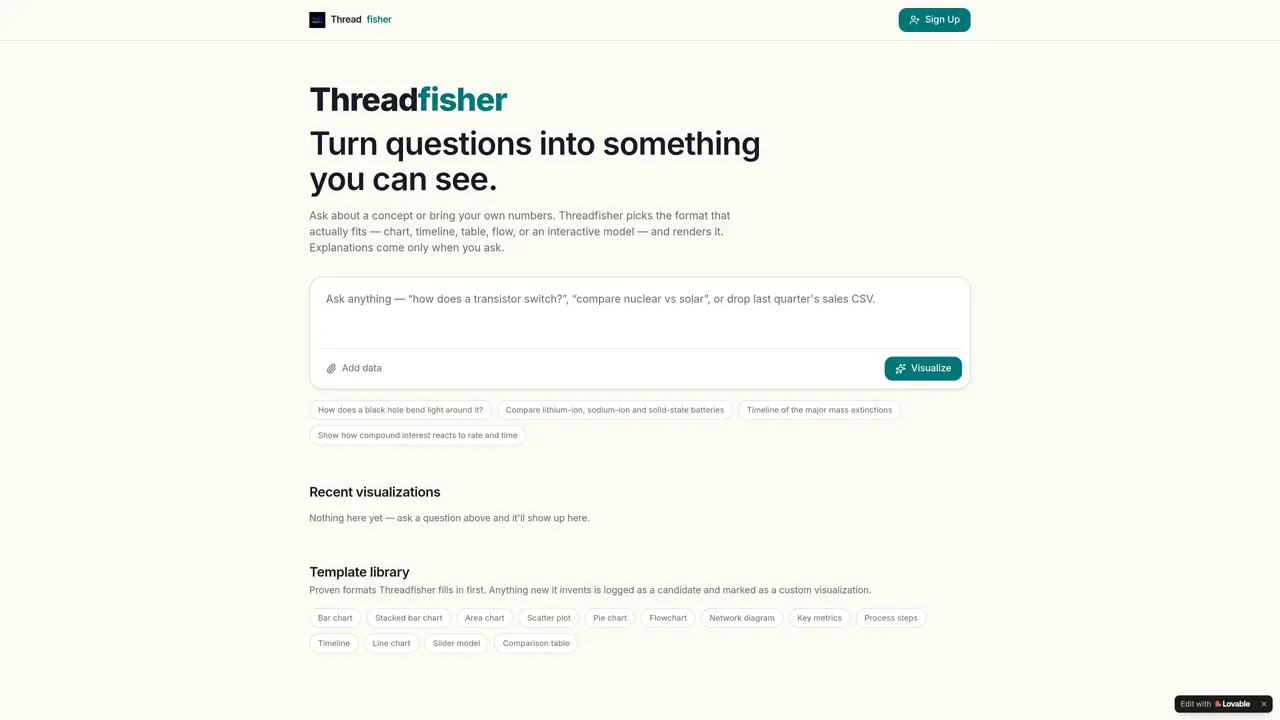
Threadfisher transforms user questions into visual representations by automatically selecting the most appropriate format for the information provided. Users can input either conceptual queries or numerical data, and the tool renders the visualization as a chart, timeline, table, flow, or interactive model without requiring manual configuration. Explanations are only displayed upon request, ensuring a clean and focused output. The system includes a template library of proven formats that are applied by default, while any newly created visualizations are logged as custom candidates for future reference. Supported formats range from bar charts and pie charts to flowcharts, network diagrams, and comparison tables, catering to diverse data presentation needs. Threadfisher is designed for users who need quick, accurate visualizations without the complexity of traditional tools. It is particularly useful for explaining concepts, comparing data sets, or tracking processes in a visually intuitive manner. The tool emphasizes simplicity and automation, making it accessible to users with varying levels of technical expertise.
Key features
- Question-to-visualization conversion
- Template library with proven formats
- Custom visualization logging
- Bar chart generation
- Timeline creation
- Table and comparison table support
- Flowchart and network diagram rendering
- Interactive model generation
Use cases
- Visualizing financial data like compound interest
- Comparing technical concepts such as battery types
- Tracking historical events with timelines
Pros
- Automatically selects appropriate visualization formats
- Supports multiple chart types and interactive models
- Includes a library of predefined templates
- Handles both conceptual questions and numerical data
- Provides explanations only when requested
Cons
- No explicit support for real-time data updates
- Limited to the formats and templates provided in the library
Frequently asked questions about Threadfisher
What does Threadfisher do?
Threadfisher converts user questions or data into visual representations such as charts, timelines, tables, flows, or interactive models. It automatically selects the most suitable format for the information provided.
Who is Threadfisher for?
Threadfisher is designed for users who need quick and accurate visualizations without manual configuration. It suits professionals, researchers, or anyone looking to explain concepts or compare data visually.
How does Threadfisher determine the best visualization format?
Threadfisher uses a template library of proven formats to select the most appropriate visualization for the input data or question. Newly created visualizations are logged as custom candidates for future use.
Can Threadfisher explain the visualizations it generates?
Explanations are provided only upon request, ensuring the initial output remains clean and focused. Users can request additional context or details as needed.
What types of visualizations does Threadfisher support?
Threadfisher supports a wide range of formats, including bar charts, stacked bar charts, area charts, scatter plots, pie charts, flowcharts, network diagrams, key metrics displays, process steps, timelines, line charts, slider models, and comparison tables.
How do I get started with Threadfisher?
Users can input a question or upload data, and Threadfisher will automatically generate a visualization. The tool is accessible via its web interface, where users can explore the template library and create custom visualizations.