An AI-driven experience management platform for enterprises to collect multi-channel feedback, analyze structured and unstructured data, and deliver actionable insights.

Chat2CSV
$15Starting price
408Monthly visits
0Popularity
About Chat2CSV
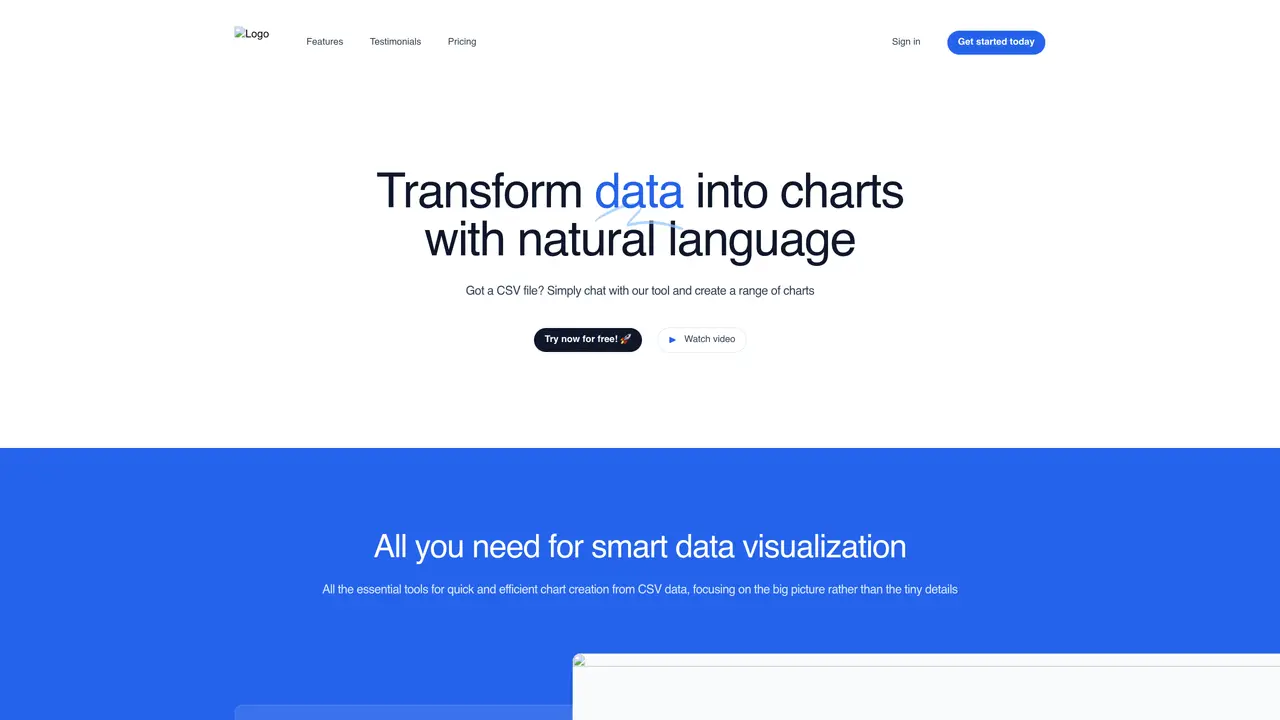
Chat2CSV is a chat-driven web tool designed for analysts, researchers, marketers, and data teams to transform CSV files into visualizations using plain-language prompts. Users upload a CSV file with headers and request charts such as bar charts, line graphs, pie charts, or scatter plots by typing commands like “create a bar chart of sales by region.” The platform supports multiple chart types and provides AI-driven recommendations for suitable visualizations based on the uploaded data. It prioritizes privacy by processing only necessary metadata on servers while keeping the actual data on the user’s device. The tool operates entirely in the browser, eliminating the need for software installation or complex BI setup. Outputs are shareable charts generated quickly for reports, presentations, or client deliverables. Chat2CSV is positioned as a low-friction alternative to traditional data visualization workflows, particularly for users who prefer conversational interaction over coding or manual chart creation.
Key features
- Natural language chart creation from CSV files
- Support for bar charts, line graphs, pie charts, and scatter plots
- AI chart type recommendations based on data
- Privacy-focused processing with client-side data handling
- Browser-based operation with no installation required
- Shareable chart outputs for reports and presentations
- Freemium pricing model with free tier available
- Multiple CSV uploads in premium tier
- 15 free queries per hour with 1MB file limit
- Planned premium features including cloud storage and chart history
Use cases
- Quickly visualizing sales or performance data from spreadsheets
- Generating client-ready charts for presentations without coding
- Exploring datasets interactively for research or analysis
Pros
- Processes only metadata on servers while keeping actual data on the user’s device for enhanced privacy
- Supports natural-language prompts to generate charts without requiring coding or scripting
- Offers a diverse range of chart types including bar charts, line graphs, pie charts, and scatter plots
- Operates entirely in the browser, eliminating the need for software installation or complex BI setup
- Provides AI-driven recommendations for suitable visualizations based on uploaded data
Cons
- Limited to CSV file uploads with headers only
- Free access includes minor daily limitations such as query and file size restrictions
- Lacks advanced data manipulation or transformation features beyond visualization
- Premium plan details are not fully finalized or widely documented
Chat2CSV videos
Frequently asked questions about Chat2CSV
What kind of files can I upload for data visualization?
The platform currently supports CSV files with headers for data visualization.
How do I command the platform to create a chart?
Users can type natural language commands, such as 'Create a bar chart of sales by region,' to generate charts.
What types of charts can I create using this platform?
The tool supports a wide range of chart types, including line graphs, bar charts, pie charts, scatter plots, and more. The AI can also suggest the most suitable chart types for the data.
How does the platform handle data security?
The platform prioritizes data security by processing only necessary metadata on its servers, while the actual data remains on the user’s device.
What does the current free access offer?
Free access allows users to explore the platform’s features with minor daily limitations, such as a capped number of queries and file size restrictions.
What additional features will the upcoming premium plan offer?
The premium plan is expected to include higher query limits, support for multiple CSV files, larger file size allowances, and additional AI prompts per file.
Chat2CSV Website Engagement
Last Update: 9 days ago
Total Monthly Visits
0
Bounce Rate
0%
Visit Duration (avg)
—
Pages Per Visit
0
Country Rank
—
Unknown
Global Rank
0