An AI-driven experience management platform for enterprises to collect multi-channel feedback, analyze structured and unstructured data, and deliver actionable insights.

Grafana
$0.01Starting price
1.1MMonthly visits
51Popularity
About Grafana
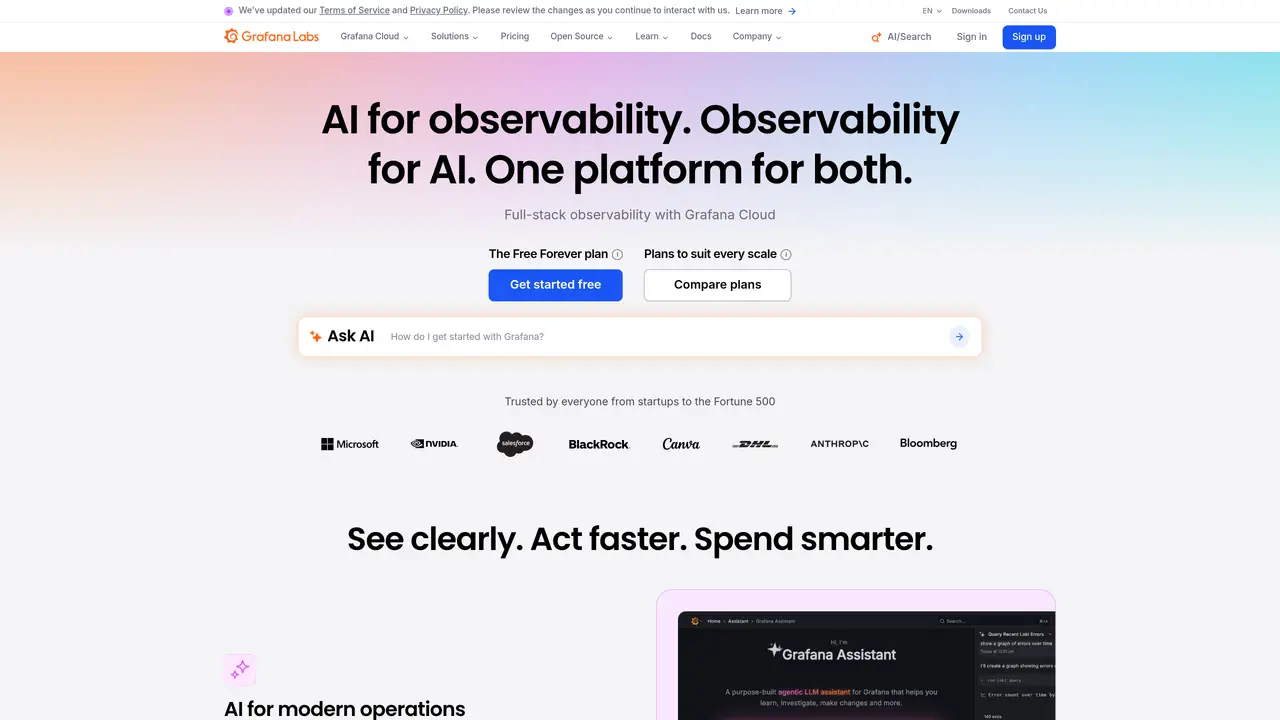
Grafana is an open source platform for analytics and monitoring that allows users to visualize data and track performance metrics. With Grafana, users can create dashboards and charts to quickly and easily monitor their applications, systems, and infrastructure. Grafana offers powerful features that provide users with deep insights into their data, including advanced alerting and notifications, data source integration, and flexible customization options. With Grafana, users can monitor their data in real-time and quickly identify potential issues. It’s a great tool for developers, DevOps engineers, and IT professionals who need to stay on top of their applications and infrastructure. Grafana also provides a comprehensive set of APIs and SDKs, so users can easily integrate their data into Grafana and create custom visualizations. With Grafana, users can gain invaluable insights into their data and make informed decisions.
Key features
- Create visualizations and dashboards to quickly and easily monitor applications, systems, and infrastructure
- Utilize advanced alerting and notifications to stay on top of performance metrics
- Integrate data sources into Grafana and create custom visualizations
- Monitor data in real-time and identify potential issues
- Provide deep insights into data with flexible customization options
- Offer a comprehensive set of APIs and SDKs for easy integration
Use cases
- Monitoring applications, systems, and infrastructure performance
- Identifying potential issues and making informed decisions
- Creating custom visualizations and dashboards for real-time monitoring
Pros
- Open source foundation with strong community and ecosystem support
- Supports full-stack observability across metrics, logs, traces, and profiles
- Native integration with OpenTelemetry and other open standards for interoperability
- AI-powered features like Grafana Assistant and Agent Observability for enhanced troubleshooting
- Flexible deployment options including cloud, on-premises, and hybrid setups
Cons
- Complexity in setup and configuration for advanced use cases
- Potential learning curve for users unfamiliar with observability concepts
Grafana videos
Frequently asked questions about Grafana
What is Grafana and what does it do?
Grafana is an open-source platform for analytics and monitoring that enables users to visualize and track performance metrics through customizable dashboards and charts. It supports real-time monitoring of applications, systems, and infrastructure, providing deep insights into data.
Who is Grafana designed for?
Grafana is designed for developers, DevOps engineers, IT professionals, and teams needing to monitor applications, infrastructure, and AI systems. It suits organizations of all sizes, from startups to large enterprises.
Does Grafana support AI-powered features?
Yes, Grafana offers AI-powered features such as Grafana Assistant for understanding telemetry, AI Investigations for root cause analysis, and Agent Observability for evaluating and improving production AI agents.
What integrations does Grafana support?
Grafana supports hundreds of plugins and integrations, including open standards like OpenTelemetry and Prometheus. It allows users to connect existing tools and data sources without requiring a rip-and-replace approach.
How does Grafana help with cost management?
Grafana Cloud includes Adaptive Telemetry, which automatically identifies and aggregates high-value data, reducing telemetry costs by optimizing spend. This helps users pay only for the data that matters.
How can I get started with Grafana?
Users can start with Grafana Cloud using the Free Forever plan, which requires no registration to try. Grafana also provides a demo environment called Grafana Play for hands-on exploration.
Grafana Website Engagement
Last Update: 9 days ago
Total Monthly Visits
0
Bounce Rate
0%
Visit Duration (avg)
0.00s
Pages Per Visit
0
Country Rank
0
United States
Global Rank
0
Category Rank
#0
Programming & Developer Software
Monthly Traffic
Traffic Sources
Traffic Share By Country
- United States18.5%
- Germany7%
- India6.8%
- United Kingdom4.8%
- China4.6%