An AI-driven experience management platform for enterprises to collect multi-channel feedback, analyze structured and unstructured data, and deliver actionable insights.

Graphy HQ
$16Starting price
108KMonthly visits
34Popularity
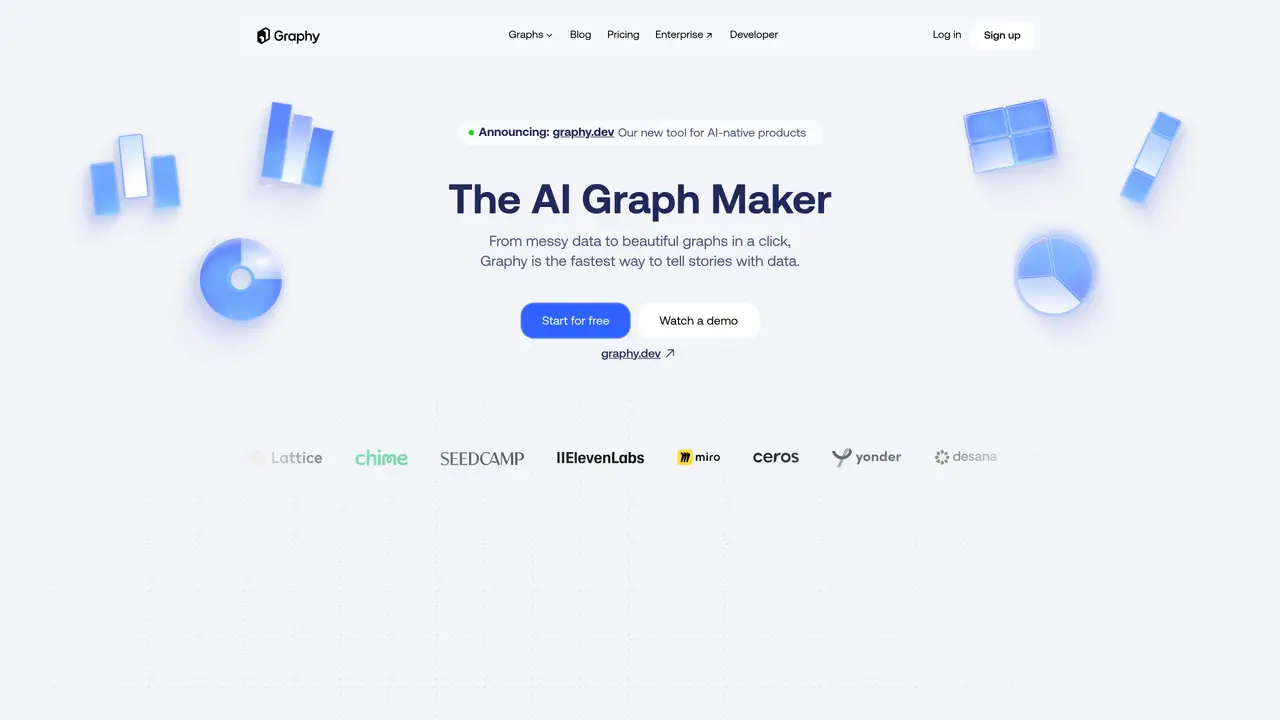
About Graphy HQ
Graphy HQ is the ultimate data analysis tool for businesses and individuals. It provides powerful AI-generated insights into your data, charts, and graphs so that you can make more informed decisions and take better-informed actions. With Graphy HQ, you can easily explore and analyze the relationships between different datasets, identify correlations, and uncover hidden trends. It even enables you to create custom visualizations, making it easy to share and present your data to colleagues and clients. Graphy HQ is ideal for data-driven decision-making, making it ideal for entrepreneurs, marketers, and analysts. It’s easy to use, highly intuitive, and provides the insights you need to make smarter decisions and drive success. With Graphy HQ, you can take your data analysis to the next level.
Key features
- Generate AI-powered insights
- Explore and visualize data relationships
- Create custom data visualizations
Use cases
- Data-driven decision-making for entrepreneurs, marketers, and analysts
- Analyzing relationships between different datasets to identify correlations and trends
- Creating custom visualizations to share and present data to colleagues and clients
Pros
- Generates visually appealing graphs from messy or unstructured data with minimal effort
- Enables rapid data storytelling through automated graph creation
- Offers a free tier for users to start creating visualizations immediately
- Designed for AI-native workflows, integrating seamlessly with modern data tools
- Provides an intuitive interface for users without advanced technical skills
Cons
- Limited customization options compared to specialized data visualization software
- May not support highly complex or niche data analysis requirements
- Free tier likely includes usage restrictions or watermarked outputs
- Dependent on AI-generated outputs, which may occasionally produce inaccuracies
Frequently asked questions about Graphy HQ
What is Graphy HQ?
Graphy HQ is an AI-powered tool designed to transform messy data into visually appealing graphs and charts with minimal effort. It enables users to create professional data visualizations quickly and share them with others.
Who is Graphy HQ for?
Graphy HQ is suitable for entrepreneurs, marketers, analysts, and anyone involved in data-driven decision-making who needs to present data clearly and effectively.
How does Graphy HQ work?
Users can input their data, and Graphy HQ’s AI automatically generates beautiful graphs and charts. The tool focuses on simplifying the process of data storytelling with minimal manual input.
Can I use Graphy HQ for free?
Graphy HQ offers a free tier to get started, allowing users to create and share graphs without an immediate financial commitment.
What types of visualizations can I create with Graphy HQ?
Graphy HQ supports a variety of graph types, enabling users to visualize data in ways that best communicate their insights and stories.
Does Graphy HQ integrate with other tools?
Graphy HQ is designed to work seamlessly with existing workflows, though specific integrations are not detailed on the website.
Graphy HQ Website Engagement
Last Update: 9 days ago
Total Monthly Visits
0
Bounce Rate
0%
Visit Duration (avg)
0.00s
Pages Per Visit
0
Country Rank
0
India
Global Rank
0
Category Rank
#0
Computers Electronics & Technology
Monthly Traffic
Traffic Sources
Traffic Share By Country
- India15.1%
- United States12.8%
- Vietnam6.3%
- United Kingdom5%
- Germany2.7%