
Design, distribute, and analyze surveys online or via email with real-time insights using Survey Monkey.
38M visits/mo-3.9%#2 Business & Marketing

Easily create stunning visuals, interactive dashboards, and transform complex data into easy-to-understand visuals.
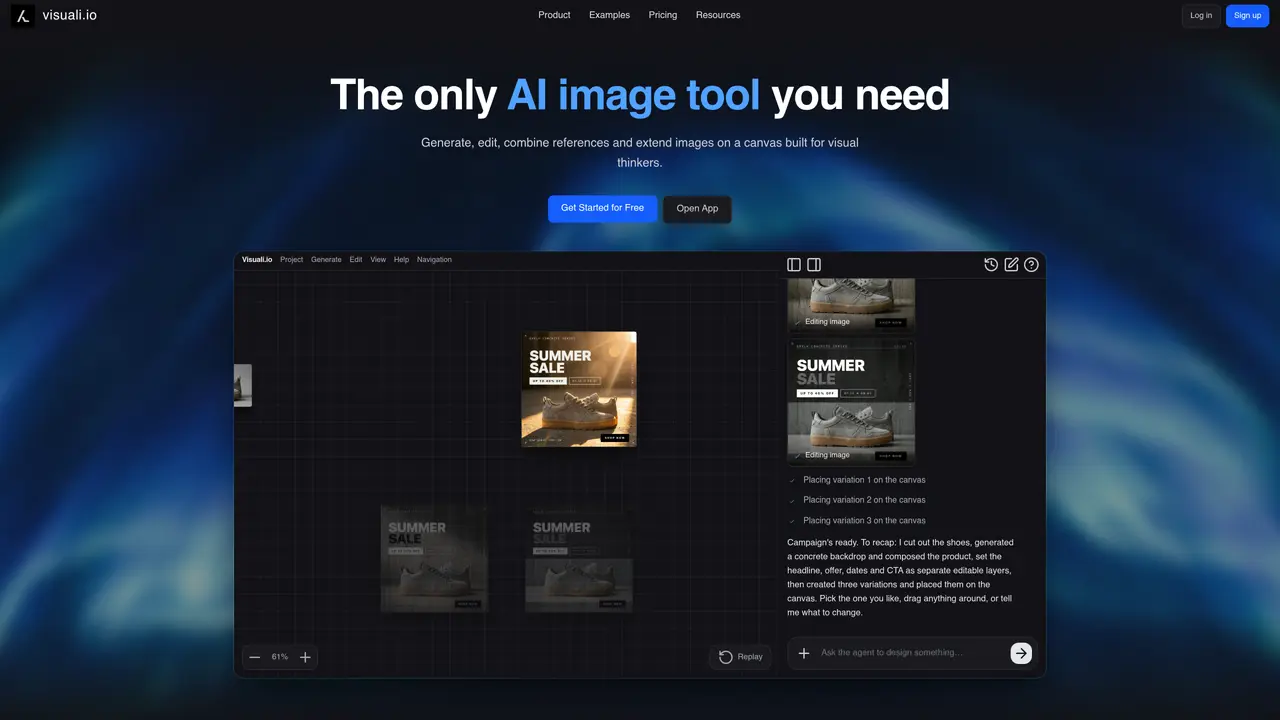
Visuali is a powerful and easy-to-use data visualization tool designed to help users quickly and easily create stunning visuals. With Visuali, you can visualize your data in a variety of ways, including charts, graphs, tables, and maps. Visuali also offers advanced features, such as the ability to create interactive dashboards and custom visuals. Whether you are a beginner or an experienced data visualization professional, Visuali can help you quickly and easily create beautiful visuals that will help you communicate your message clearly and effectively. With Visuali, you can transform complex data into easy-to-understand visuals, helping you to make informed decisions and tell powerful stories. With its intuitive and user-friendly interface, Visuali makes data visualization a breeze, allowing you to focus on the task at hand and achieve the results you need.
Visuali is an AI-powered image generation and editing tool that allows users to create, edit, and expand images on an infinite canvas. It combines an AI agent with manual editing tools to generate images from text, edit existing images, and arrange visuals into documents or moodboards.
Visuali is designed for visual thinkers, including designers, marketers, architects, and creators who need to generate, edit, and organize images efficiently. It suits both beginners and professionals looking for a flexible workspace.
The AI agent in Visuali operates directly on the canvas, allowing users to describe edits or additions in natural language. It can generate images, edit existing ones, add text, shapes, and icons, and even build full layouts based on user instructions.
Yes, Visuali runs in any browser and can be installed as a full-screen app on phones, tablets, laptops, and desktops. It offers a full mobile experience with pan, zoom, and editing capabilities.
Visuali supports inpainting and outpainting for image editing, allowing users to erase, replace, or expand elements. It also enables manual drawing, text addition, shape creation, and layer-based organization with nondestructive editing.
Visuali allows exporting images as PNG or JPEG with custom quality and resolution settings. Users can also export with transparent backgrounds and manage multiple layers during the export process.
visuali.io · third-party estimates from Similarweb
Last 4 months · grows by one month every month
Share of visits · estimated visits
Business & Marketing · Sep 2026
Traffic figures are third-party estimates, good for scale and trends; they can differ from a company's own numbers. Updated monthly.
We use essential cookies to run aitoolnavio™, and optional cookies to analyze traffic and measure our marketing. You choose what we use — optional cookies stay off unless you turn them on. See our Privacy Policy.
One short email a week: fresh tools worth trying, honest takes and the updates that actually matter. No spam, unsubscribe any time.
Design, distribute, and analyze surveys online or via email with real-time insights using Survey Monkey.
Create targeted campaigns, automate email campaigns, and analyze performance for maximum ROI.
Discover keywords, analyze competitors' SEO strategies, and make data-driven decisions for website performance.
Analyze website performance, track competitors' tactics, and access comprehensive analytics and optimization features.
YouTube and Instagram growth toolkit with AI-powered optimization and analytics
Develop, run data jobs, transform datasets, leverage ML algorithms for actionable insights.
Streamline hiring, monitor job performance, and choose flexible pricing plans.
Unified AI-powered platform for real-time monitoring, analytics, and security across cloud infrastructure, applications, and services.
Securely store, analyze, and scale data while enhancing security and performance with encryption and automated backups.
AI-powered customer feedback platform for mid-market businesses to run conversational surveys and extract insights.
Automate review requests, analyze sentiment, and monitor ratings with a streamlined dashboard for improved customer feedback.
Monitor brand performance, create content for social media, and gain insights with deep analytics.
Matched on what this tool does — grouped by the job you would be replacing.
matches Create interactive dashboards · Transform complex data into easy-to-understand visuals · Visualize data in various ways, including charts, graphs, tables, and maps
Visualize processes, design network diagrams, and collaborate in real-time with templates and easy-to-use interface.
Turns data into interactive charts, infographics, and presentations with a drag-and-drop editor and real-time collaboration.
Create interactive charts and graphs, customize visuals, and share data visualizations for collaboration.
Generate automated insights, identify trends, patterns, visualize data with powerful dashboard and tools.
matches Quickly create stunning visuals · Create custom visuals
matches Create stunning visuals
Create stunning visuals, develop ideas with AI-powered tools, and instantly share content without coding or formatting.
Easily create stunning visuals with customization options, even without design experience.
Generate free high-quality visuals, easily create stunning images in browser, with a wide range of effects and filters.
Create custom titles, 3D objects, adjust color and contrast, add special effects, transitions, and animations.
AI-powered 3D editor that lets users create, edit, and animate 3D models using simple text prompts.