
Unleash creativity: edit photos, videos, and designs with AI-enhanced tools.
16M visits/mo-11.4%#6 Image & Design

An AI wireframing tool for BI teams that generates dashboard mockups from prompts and exports to Tableau or Power BI.
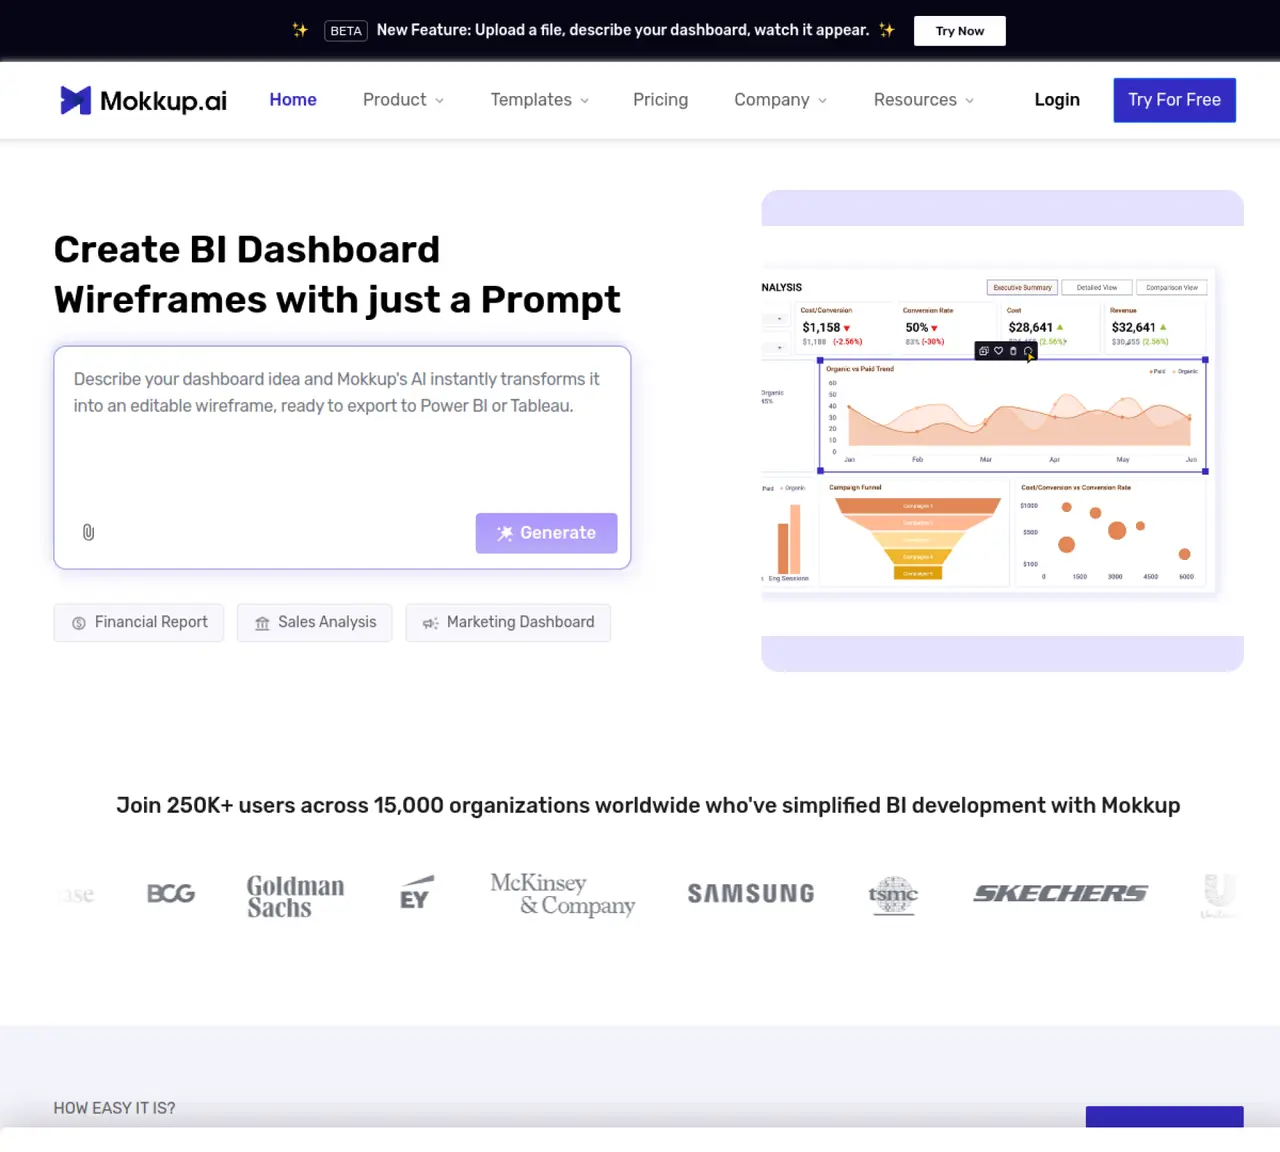
Mokkup.ai is a web-based AI wireframing tool designed for data analysts, BI developers, and dashboard designers who need to create dashboard mockups quickly for data visualization projects. It enables users to generate dashboard layouts directly from text prompts or start from scratch using a drag-and-drop widget library. The platform offers over 250 dashboard templates and supports real-time collaboration features such as sharing and commenting to streamline stakeholder feedback. Once wireframes are approved, users can export them directly into Tableau or Power BI formats, reducing the need for rework between design and implementation. Mokkup.ai focuses on BI-first wireframing, helping teams validate dashboard structure and visuals early in the development process. The tool is accessible via a web browser and is available in a freemium model with paid plans for individuals and teams.
Mokkup.ai is a web-based AI wireframing tool designed for data analysts, BI developers, and dashboard designers to create dashboard mockups quickly for data visualization projects.
Users can generate dashboard layouts directly from text prompts or start from scratch using a drag-and-drop widget library, with over 250 dashboard templates available.
Yes, wireframes can be exported directly into Tableau or Power BI formats with pre-configured metrics, measures, and formulas, reducing rework between design and implementation.
Yes, the platform offers real-time collaboration features such as sharing, commenting, and team editing to streamline stakeholder feedback.
Mokkup.ai is available in a freemium model with paid plans for individuals and teams.
Users can start by signing up for a free account on the Mokkup.ai website and accessing the tool via a web browser.
mokkup.ai · third-party estimates from Similarweb
Last 4 months · grows by one month every month
Share of visits · estimated visits
Other countries: 44.5%
How people reach this site from other AI tools
380 a month · 0.5% of all visits
Image & Design · Sep 2026
Traffic figures are third-party estimates, good for scale and trends; they can differ from a company's own numbers. Updated monthly.
We use essential cookies to run aitoolnavio™, and optional cookies to analyze traffic and measure our marketing. You choose what we use — optional cookies stay off unless you turn them on. See our Privacy Policy.
One short email a week: fresh tools worth trying, honest takes and the updates that actually matter. No spam, unsubscribe any time.
Unleash creativity: edit photos, videos, and designs with AI-enhanced tools.
A drag-and-drop design platform for presentations and social graphics with AI photo tools and a large template library.
Create captivating, customizable presentations and easily share them across devices with a cloud-based platform.
Generate custom visuals for blogs, create unique social media images, and design eye-catching visuals for marketing campaigns.
Create stunning designs, edit photos, remove objects, make collages, and transform images with powerful AI tools and effects.
Create auto-resized campaign images and videos with DaVinci AI's generative media suite.
Create precise 3D models, collaborate on designs, and analyze simulations in real-time.
Cloudinary provides APIs and tools to integrate, manage, and optimize images and videos for AI-driven visual experiences.
Generate custom color palettes instantly with AI or from images for design projects.
Turn simple prompts into flyers, social posts, emails, event pages, and tickets using AI-powered design and marketing tools.
Generate high-quality images with flawless embedded text from text prompts, plus batch output and style control in a creative canvas.
Edit, transform, and enhance photos with text prompts using our free AI photo editor online.
Matched on what this tool does — grouped by the job you would be replacing.
matches Prompt-to-wireframe generation from text prompts · One-click export to Tableau and Power BI formats · Start from scratch or use AI-generated layouts
Create stunning prototypes, enhance UX with AI-driven features, and produce professional-grade visuals effortlessly.
Turns CSV, Excel, and PDF files into editable dashboards and reports with AI edits, refresh, and templates.
An AI no-code web design tool that generates sitemaps, wireframes, and styled pages from prompts and exports projects to Webflow.
matches Prompt-to-wireframe generation from text prompts · 250+ dashboard templates and drag-and-drop widget library · Real-time collaboration with sharing and commenting
Visual collaboration platform for creating diagrams, mind maps, wireframes, and workflows with real-time teamwork.
Harness AI to craft, collaborate, and iterate UI designs effortlessly.
AI-powered wireframing and whiteboard tool for teams to create, collaborate on, and export UI concepts and prototypes.
Generate interactive prototypes from text or Figma designs instantly with AI, ideal for teams without design expertise.