An AI-driven experience management platform for enterprises to collect multi-channel feedback, analyze structured and unstructured data, and deliver actionable insights.

Scoop Analytics
$100Starting price
8.6KMonthly visits
16Popularity
About Scoop Analytics
Scoop Analytics is a web-based AI data analytics and agentic BI platform designed for enterprise operations leaders, marketing teams, sales operations, and customer support teams that need answers from data without writing SQL. The platform enables users to ask questions in plain English, receive confidence-rated answers, and run multi-step investigations including root-cause analysis and ML-driven pattern detection. It supports over 100 data connectors for CRMs, marketing platforms, and data warehouses such as Salesforce, HubSpot, Google Analytics, Meta Ads, Snowflake, and BigQuery, along with CSV and Excel uploads for ad hoc datasets. An in-memory spreadsheet engine with 150+ Excel-compatible functions (e.g., VLOOKUP, SUMIFS) allows calculations on large datasets, while automatic data snapshotting builds time-series datasets. Insights can be shared via Slack with channel-inherited security, ensuring distribution aligns with team workflows. The platform operates on a three-layer architecture: BI Foundation for connections and dashboards, AI Analytics for Q&A and investigations, and Domain Intelligence for autonomous insight discovery based on business context. It also offers Salesforce AppExchange support for dynamic dashboards and enterprise readiness, including SOC 2 Type II compliance.
Key features
- Natural language data querying with confidence levels
- Multi-step investigations and root-cause analysis
- 100+ pre-built data connectors for CRMs, marketing platforms, and warehouses
- In-memory spreadsheet engine with 150+ Excel-compatible functions
- Automatic data snapshotting and time-series dataset creation
- Slack integration with channel-inherited security for sharing insights
- Three-layer architecture: BI Foundation, AI Analytics, and Domain Intelligence
- Salesforce AppExchange support for dynamic dashboards
- SOC 2 Type II compliance for enterprise security
- CSV and Excel uploads for ad hoc datasets
Use cases
- Automating recurring reports for marketing and sales teams
- Investigating customer support trends and identifying root causes
- Building and sharing time-series datasets for operations managers
Pros
- Automates diagnostic work and delivers plain-language action plans to managers without manual intervention
- Designed for distributed organizations with 50+ locations, enabling consistent best practices across all units
- Integrates with existing BI tools (Power BI, Tableau, Looker, Snowflake, BigQuery) to enhance rather than replace current systems
- Tracks the effectiveness of recommended actions and continuously monitors performance drifts
- Codifies tribal knowledge from top operators to scale expertise across all locations
Cons
- Primarily focused on distributed businesses with 50+ locations, limiting suitability for smaller teams
- Requires an existing data warehouse or BI stack to function effectively
- May not address highly customized or unique operational workflows outside standard KPIs
- Implementation involves a four-week pilot phase, which may delay immediate adoption
Frequently asked questions about Scoop Analytics
What does Scoop Analytics do?
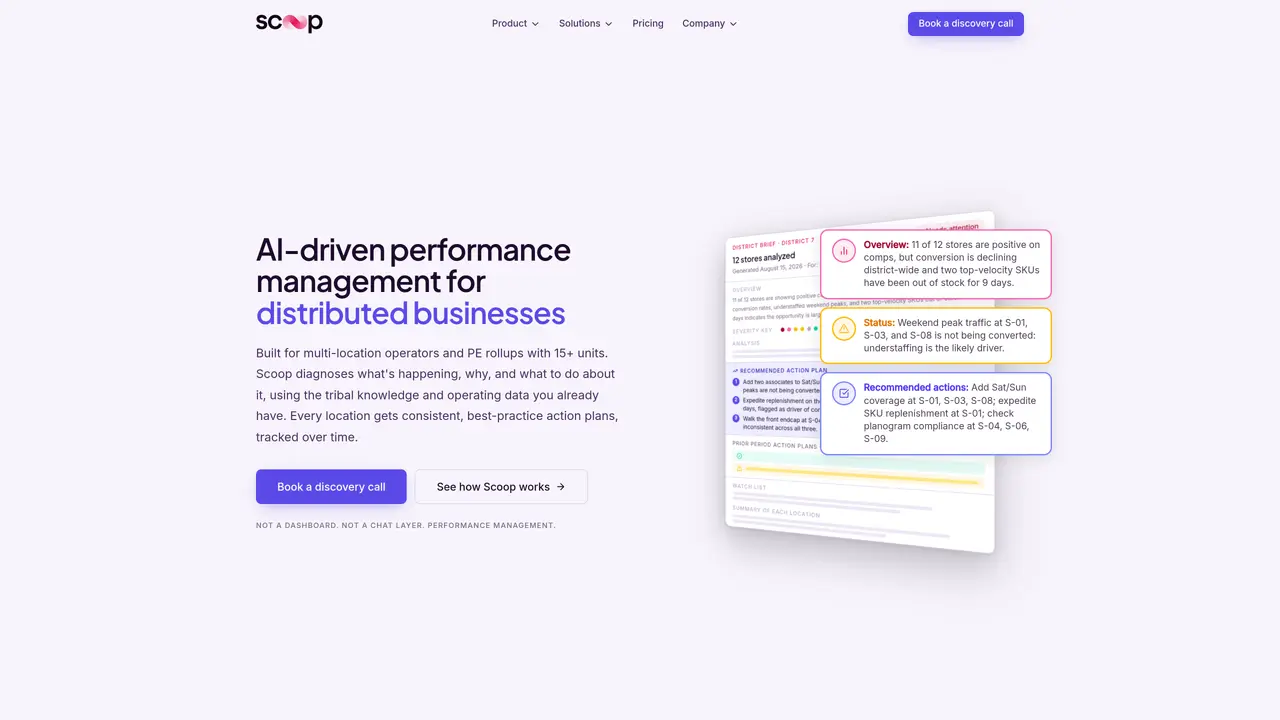
Scoop Analytics is an AI-driven performance management platform designed for distributed businesses. It automatically diagnoses performance issues, identifies root causes, and generates actionable plans for each location, complementing existing BI tools.
Who is Scoop Analytics best suited for?
Scoop is ideal for multi-location operators, retail chains, hospitality businesses, franchise networks, and private equity rollups with 50+ locations or distinct units. It standardizes operational insights and action plans across all locations.
How does Scoop Analytics integrate with existing tools?
Scoop layers on top of existing BI stacks such as Power BI, Tableau, Looker, Snowflake, BigQuery, and Redshift. It connects to operational data sources to automate diagnostics and action planning without disrupting current workflows.
What kind of outputs does Scoop Analytics provide?
The platform generates role-specific reports like district briefs and store reports, which include performance diagnostics, recommended actions, and tracking of results. These outputs are delivered automatically every reporting cycle.
How long does it take to implement Scoop Analytics?
Scoop aims for a fast time-to-value, with a typical pilot going live within four weeks. Implementation requires minimal IT lift and relies on existing data warehouse or BI infrastructure.
Does Scoop Analytics replace existing BI tools?
No, Scoop complements BI tools by automating the diagnostic and action-planning process. It answers the 'why' behind performance trends and provides actionable insights, which traditional BI tools do not address.
Scoop Analytics Website Engagement
Last Update: 9 days ago
Total Monthly Visits
0
Bounce Rate
0%
Visit Duration (avg)
0.00s
Pages Per Visit
0
Country Rank
0
United States
Global Rank
0
Monthly Traffic
Traffic Sources
Traffic Share By Country
- United States81.6%
- India14.1%
- Philippines3.8%
- Hong Kong0.5%