
Design, distribute, and analyze surveys online or via email with real-time insights using Survey Monkey.
38M visits/mo-3.9%#2 Business & Marketing

Web analytics platform that combines quantitative metrics with qualitative insights to identify and fix
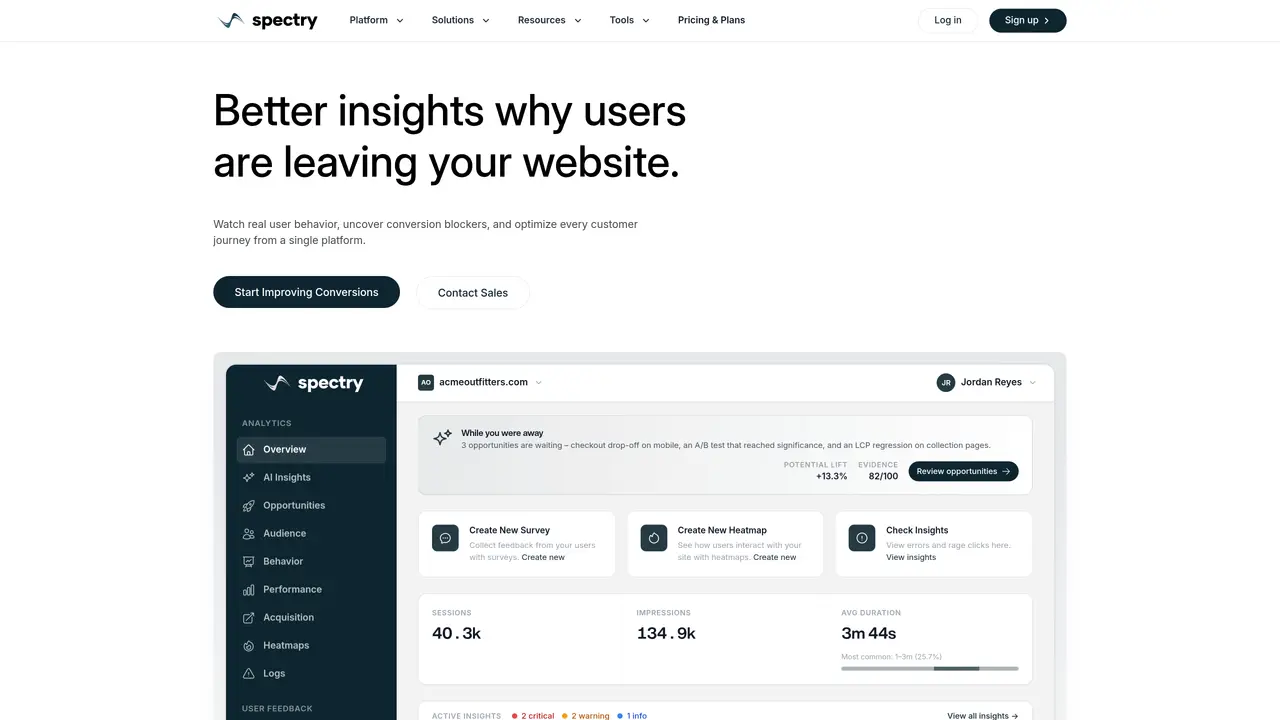
Spectry provides a web analytics platform that combines quantitative metrics with qualitative insights such as heatmaps, session replays, user feedback, and error tracking. It is designed to help teams understand why users are leaving a website and identify conversion blockers. The tool offers AI-powered analytics to detect UX issues, errors, and drop-off points, prioritizing fixes based on potential impact. Users can track engagement patterns, run A/B tests, and measure the impact of changes without guessing. The platform includes features like conversion funnels, opt-in forms, and custom events, all accessible from a single dashboard. Data is hosted in the EU, GDPR compliant, and privacy-focused with PII masking and consent management. It supports integration with other tools and offers transparent pricing plans that scale with traffic.
Spectry combines quantitative metrics with qualitative insights like heatmaps, session replays, user feedback, and error tracking to help teams understand why users are leaving a website and identify conversion blockers.
Spectry is designed for teams looking to optimize website performance, including product managers, UX designers, marketers, and developers who need to diagnose and fix conversion issues.
Yes, Spectry provides a free plan with 5,000 sessions per month that includes analytics, session replays, heatmaps, surveys, and opt-in forms, with no credit card required.
Yes, Spectry is GDPR compliant, hosts data in the EU, and includes features like PII masking and consent management to protect user privacy.
Yes, Spectry supports integration with other tools and platforms, allowing users to connect their existing workflows and data sources.
Spectry uses AI-powered analytics to detect UX issues, errors, and drop-off points, then prioritizes fixes based on potential impact to maximize conversion improvements.
spectry.io · third-party estimates from Similarweb
Last 3 months · grows by one month every month
Share of visits by channel
Share of visits · estimated visits
Business & Marketing · Sep 2026
Traffic figures are third-party estimates, good for scale and trends; they can differ from a company's own numbers. Updated monthly.
We use essential cookies to run aitoolnavio™, and optional cookies to analyze traffic and measure our marketing. You choose what we use — optional cookies stay off unless you turn them on. See our Privacy Policy.
One short email a week: fresh tools worth trying, honest takes and the updates that actually matter. No spam, unsubscribe any time.
Design, distribute, and analyze surveys online or via email with real-time insights using Survey Monkey.
Create targeted campaigns, automate email campaigns, and analyze performance for maximum ROI.
Discover keywords, analyze competitors' SEO strategies, and make data-driven decisions for website performance.
Analyze website performance, track competitors' tactics, and access comprehensive analytics and optimization features.
YouTube and Instagram growth toolkit with AI-powered optimization and analytics
Develop, run data jobs, transform datasets, leverage ML algorithms for actionable insights.
Streamline hiring, monitor job performance, and choose flexible pricing plans.
Unified AI-powered platform for real-time monitoring, analytics, and security across cloud infrastructure, applications, and services.
Securely store, analyze, and scale data while enhancing security and performance with encryption and automated backups.
AI-powered customer feedback platform for mid-market businesses to run conversational surveys and extract insights.
Automate review requests, analyze sentiment, and monitor ratings with a streamlined dashboard for improved customer feedback.
Monitor brand performance, create content for social media, and gain insights with deep analytics.
Matched on what this tool does — grouped by the job you would be replacing.
matches Session replays and heatmaps for user behavior analysis · Conversion funnels and A/B testing capabilities · User feedback collection via surveys and opt-in forms
Open-source platform combining product analytics, session replay, A/B testing, and feature flags in one toolkit for product engineers.
Web and app experience analytics with heatmaps, replays, surveys and AI insights
Behavioral analytics platform capturing and analyzing user interactions
Revolutionize website performance with AI-driven user behavior insights and real-time analytics.