
Create stunning visuals, develop ideas with AI-powered tools, and instantly share content without coding or formatting.

GANTT360°
€12/mStarting price
0Popularity
About GANTT360°
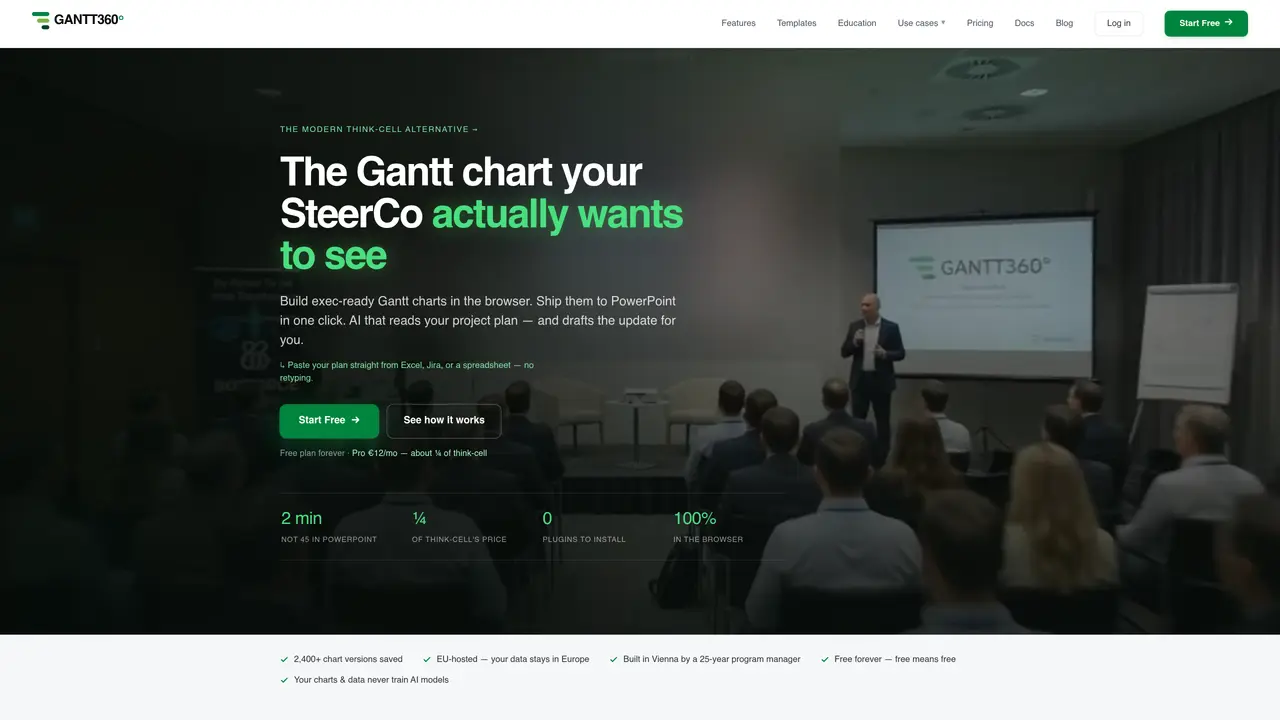
GANTT360° is a browser-based Gantt chart studio designed for creating presentation-grade charts that can be shared with executives. The tool allows users to paste project plans directly from spreadsheets or project management systems like Excel or Jira, converting tasks, dates, and owners into visual bars instantly. Users can then adjust timelines, dependencies, and phases by dragging bars, with the chart automatically reflowing to reflect changes. Charts can be exported as editable PowerPoint shapes, enabling recipients to modify text, resize bars, and adjust colors directly in PowerPoint. The platform includes AI features that generate executive summaries, detect risks, and provide scenario planning suggestions based on the live chart data. Charts can also be shared via interactive, drill-enabled links that are mobile-responsive and do not require recipients to log in. Version history is automatically saved, allowing users to compare or restore previous versions with a single click.
Key features
- Paste from Excel, Jira, or spreadsheets
- Drag-and-drop timeline adjustments with auto-reflow
- Editable PowerPoint export
- AI-generated executive summaries
- Interactive shareable links
- Version history with one-click restore
- Live KPI dashboard
- Swimlane and critical path views
Use cases
- Creating executive-ready Gantt charts for steering committees
- Generating weekly status reports with AI assistance
- Sharing interactive project timelines via embeddable links
Pros
- Browser-based with no plugins required
- Exports charts as editable PowerPoint shapes
- AI-powered features for risk detection and status reports
- Free plan available with no time limits
- EU-hosted data storage
Cons
- No native project management features
- Free plan limited to 3 charts
- PowerPoint export requires Pro plan
- AI features restricted to paid plans
Frequently asked questions about GANTT360°
What is GANTT360°?
GANTT360° is a presentation-grade Gantt chart studio that operates entirely in the browser. It creates executive-ready Gantt charts suitable for steering committees, offering features like AI-generated summaries, risk detection, and PowerPoint export without requiring plugins.
How is GANTT360° different from project management tools like Jira, Asana, or Monday?
GANTT360° is not a project management tool; it lacks task assignments, workflows, or notifications. Instead, it specializes in building executive-facing charts quickly from existing project data, such as spreadsheets or Jira exports, for presentation purposes.
Does GANTT360° export to PowerPoint?
Yes, charts export as editable PowerPoint shapes, allowing recipients to modify text, resize bars, and adjust colors directly in PowerPoint, similar to think-cell exports.
Is there a free version of GANTT360°?
Yes, GANTT360° offers a genuinely free plan with no trial period or automatic upgrades. The free plan includes 3 charts, PNG export, and a KPI dashboard, with optional upgrades for advanced features.
What AI features does GANTT360° include?
GANTT360° includes AI-powered features such as executive summary generation, risk detection, what-if scenario planning, AI advisor chat, and automated weekly status reports based on live chart data.
Can I share a chart with people who don’t have an account?
Yes, charts can be shared via interactive, drill-enabled links that are mobile-responsive and do not require recipients to log in.