AI assistant for safe, reliable productivity with code, collaboration, and integrations.

Rhubarb
0Popularity
About Rhubarb
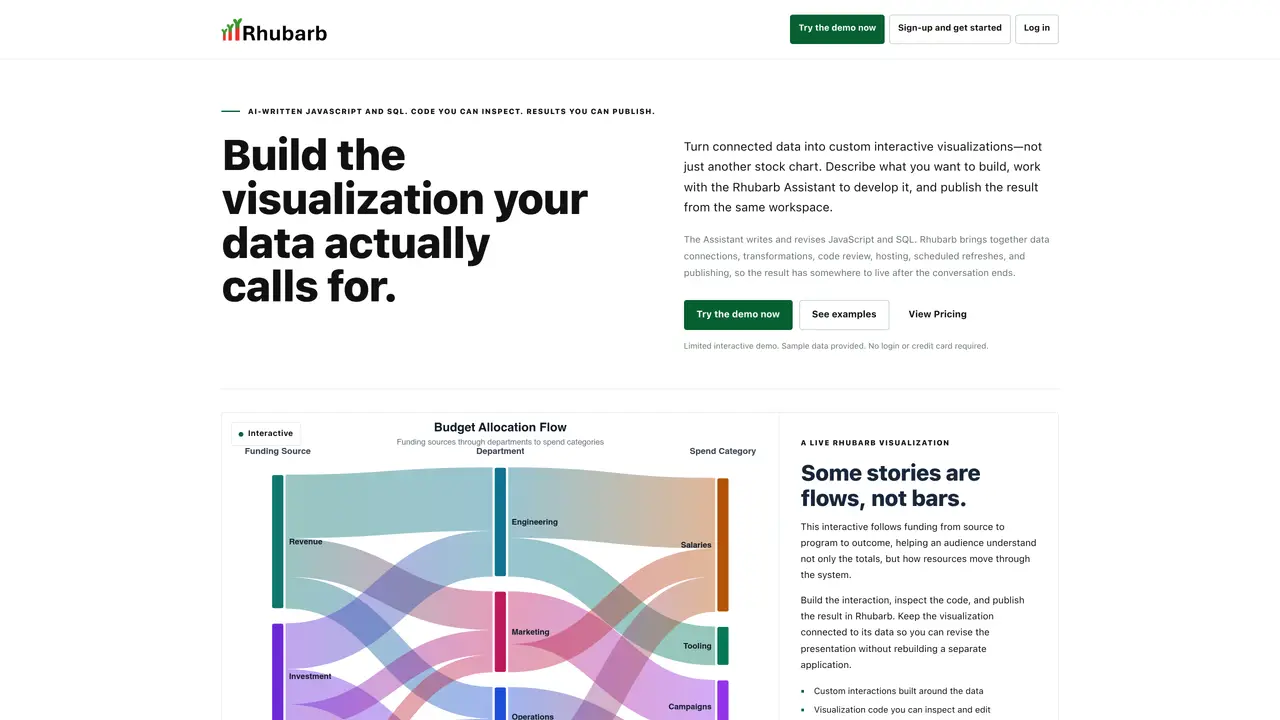
Rhubarb is a platform that combines AI assistance with SQL and JavaScript to create custom interactive data visualizations. It allows users to describe the visualization they want, work with an AI assistant to develop it, and then publish the result directly from the workspace. The tool integrates data connections, transformations, code review, hosting, scheduled refreshes, and publishing into a single environment. Users can connect databases or upload CSV or JSON files, then use the assistant to write and revise queries, transform data, and build custom charts or maps. The platform supports libraries such as D3, Plotly, Chart.js, and Vega-Lite, enabling the creation of complex interactions beyond standard chart templates. Visualizations remain connected to their data sources, allowing for easy revisions without rebuilding separate applications. The workspace includes version history for tracking changes and rolling back if needed.
Key features
- AI-written JavaScript and SQL code generation
- Custom interactive visualizations beyond stock charts
- Data connection to databases or CSV/JSON uploads
- SQL transformations and data filtering
- Support for D3, Plotly, Chart.js, Vega-Lite, and GeoJSON
- Hosted publishing with scheduled data refreshes
- Code inspection and version history
- Live visualization updates without rebuilding applications
Use cases
- Creating custom Sankey diagrams for resource flow analysis
- Building interactive maps with GeoJSON for geographic data
- Developing bespoke D3 visualizations for client reports
Pros
- AI assistant generates and revises JavaScript and SQL code
- Supports custom interactions and visualizations beyond standard templates
- Integrates data connections, transformations, hosting, and publishing in one workspace
- Allows inspection and editing of generated code
- Supports scheduled data refreshes for maintaining live visualizations
Cons
- Limited interactive demo with sample data only
- Assistant usage and features restricted without a full account
- No support for uploading or transforming custom data in the demo
Frequently asked questions about Rhubarb
What is Rhubarb and what does it do?
Rhubarb is a platform that combines AI assistance with SQL and JavaScript to create custom interactive data visualizations. Users describe the visualization they want, work with an AI assistant to develop it, and publish the result directly from the workspace.
Who is Rhubarb designed for?
Rhubarb is designed for founders, analysts, program teams, and other data-savvy individuals who need to create custom interactive visualizations without the overhead of separate software projects or rigid chart templates.
How does the Rhubarb Assistant work?
The Rhubarb Assistant helps write queries, transform data, and build or revise interactive visualizations based on user descriptions. Users can inspect and edit the underlying SQL and JavaScript code produced by the assistant.
Can I use my own data in Rhubarb?
Yes, users can connect databases or upload their own CSV or JSON files. The platform supports data transformations, scheduled refreshes, and hosting for published visualizations.
What libraries does Rhubarb support for building visualizations?
Rhubarb supports libraries such as D3, Plotly, Chart.js, and Vega-Lite, enabling the creation of complex interactions and custom charts beyond standard templates.
Is there a way to try Rhubarb before signing up?
Yes, Rhubarb offers a limited interactive demo with sample data provided, allowing users to try the Assistant and explore examples without logging in or providing a credit card.